
01 / What exists
Displayed limit orders, spread, depth, execution quality and actual completed trades. Visibility depends on the venue and feed.
BLACK BOX JOURNEY / CAPTAIN FIELD MASTERCLASS 01
An advanced, evidence-first guide to visible liquidity, hypothetical stop clusters, higher-timeframe levels, failed breaks and sustained acceptance. A Captain learns to separate what a chart shows from what it merely suggests.
Displayed limit orders, spread, depth, execution quality and actual completed trades. Visibility depends on the venue and feed.
Possible buy stops above highs and sell stops below lows, based on common placement behaviour. Exact stop sizes are not shown.
Wait for a defined reaction, manage adverse scenarios, measure costs and skip trades when no objective setup is present.
SECTION 01 / MARKET MECHANICS
In market microstructure, liquidity concerns how readily orders can execute, at what cost and with how much price impact. Passive limit orders can supply executable interest on a venue; aggressive orders consume available quotations. A stop order is conditional and may become marketable after its trigger. A candlestick chart alone cannot show how many hidden stops sit behind a level.
Potential buy-side stop activity: short positions may have buy-to-cover stops there, while breakout traders may place buy stops. Neither order type's size is proved by the chart.
Potential sell-side stop activity: long positions may have protective sell stops, while breakout sellers may place sell-stop entries below the low.
SECTION 02 / REFERENCE LEVELS
Previous-day, weekly and monthly extremes, session levels, old swings, equal highs/lows and trendlines are candidates for observation. Higher timeframe does not automatically mean more orders: its relevance must be tested, not assumed.
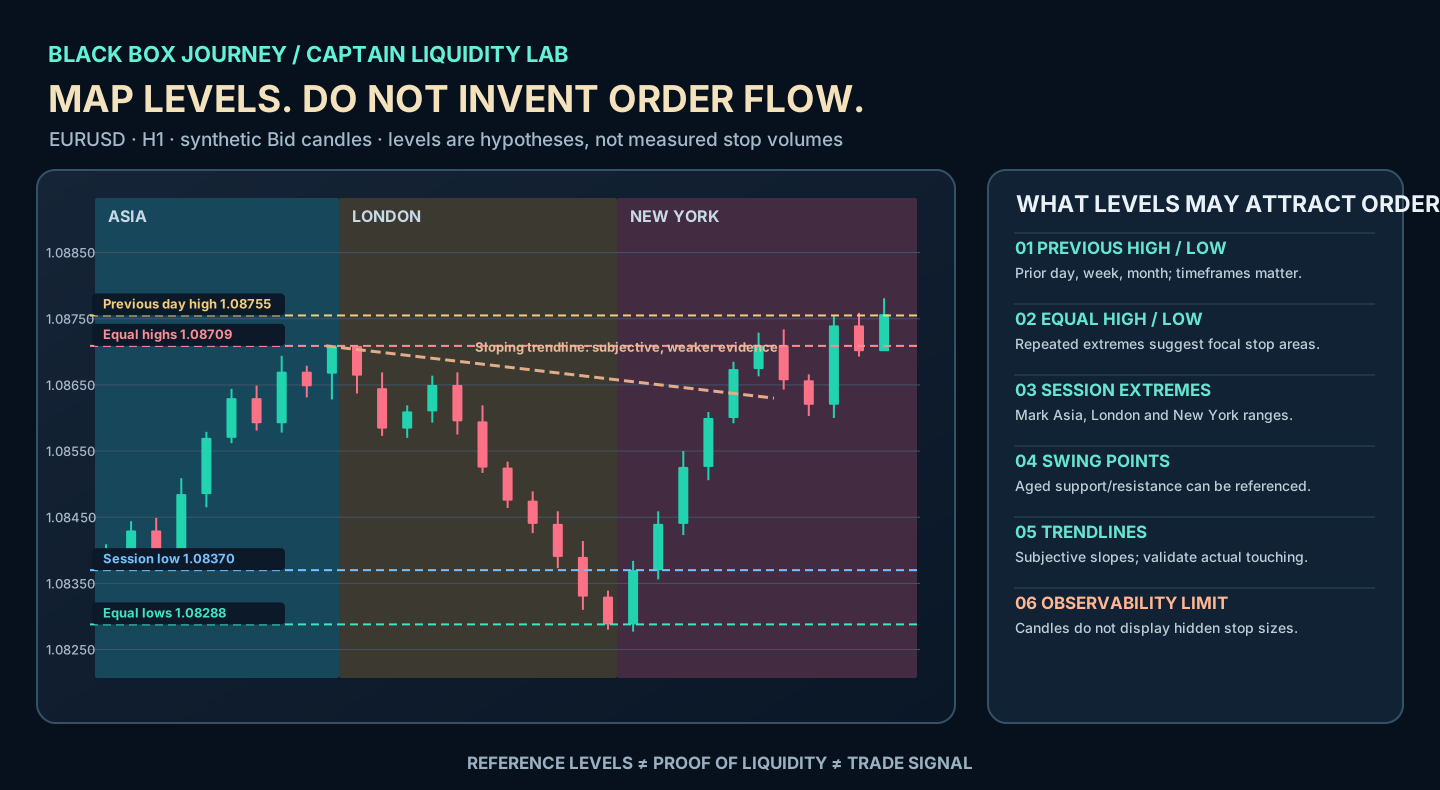
Repeated highs are reference levels where buy-stop orders may sit above the highs. Stops are not visible from a candlestick alone.
Repeated lows are reference levels where sell-stop orders may sit below the lows. A break does not guarantee a bounce.
Previous extremes give clear shared reference prices. Importance depends on regime, instrument and current trading conditions.
Track completed Asia, London and New York ranges using a clearly defined session clock, broker timezone and daylight-saving rule.
Prior structural turning points are candidate reference areas. Age, repeat tests and market context change their relevance.
Repeated touches can draw attention, but trendlines are subjective and a single break cannot prove intent or actual stop volume.
SECTION 03 / OBSERVE THE REACTION
The same previous high can precede a reversal or a continuation. A wick through the high with a close back below is evidence of rejection at that timeframe, not proof of the ultimate move. Closes above the level, a successful retest and continued structure are evidence compatible with acceptance. Neither case is a validated strategy by itself.
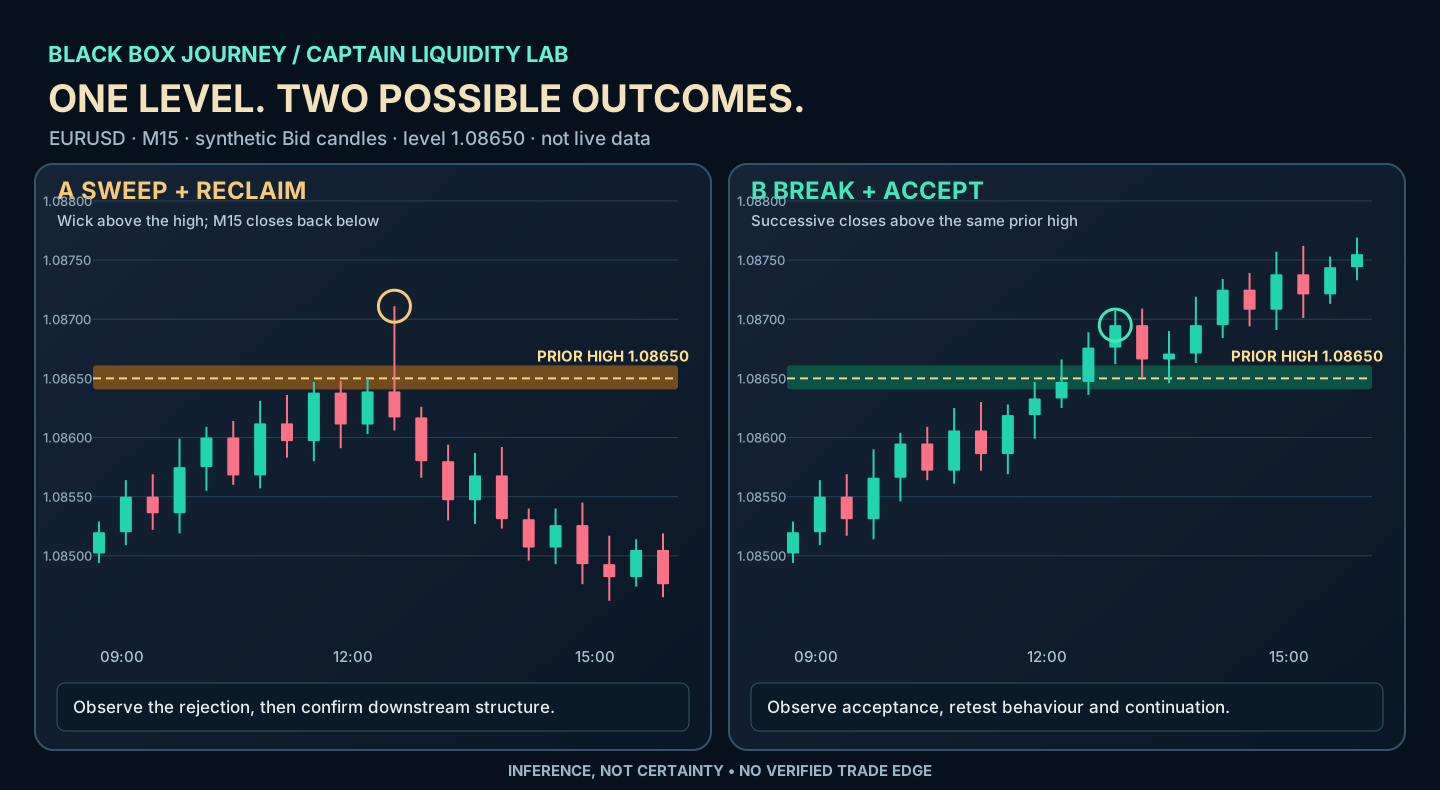
Reference high: 1.08650. A synthetic M15 candle trades to 1.08711, then closes at 1.08617, back beneath the reference. The observation is a failed hold above the high. The next questions concern structure, invalidation, costs and whether subsequent candles actually follow through lower.
The market moves past the same 1.08650 reference and records consecutive closes above it. A later pullback remains above the reference before continuing. This is compatible with a continuation hypothesis; it does not make that continuation certain.
SECTION 04 / CAPTAIN DECISION PROTOCOL
01 / Locate
Mark levels known before the event: old highs/lows, previous day extremes, session range and selected HTF structures.
02 / Observe
Record which quote/candle feed is used, the excursion beyond the level, the close and any retest. Do not backfill a perfect level.
03 / Confirm
Define in advance what distinguishes failed break, acceptance, no-trade or inconclusive behaviour. Multiple closes are a heuristic, not a universal rule.
04 / Control
Specify the invalidation price and position-size rule. Include spread, commissions, slippage, news and session volatility. Skip if loss is unacceptable.
05 / Review
Journal all opportunities, including skipped and losing cases; compare out-of-sample outcomes and costs before teaching a statistical trading edge.
SECTION 05 / PRACTISE YOUR REASONING
Choose one answer to each question. These are formative self-checks only. They do not count toward the private Captain final exam or change your academic record.
0 of 4 checked · 0 correct
SECTION 06 / FIELD ASSIGNMENT
Using a demo chart or independent historical screenshots, mark five distinct prior highs/lows before revealing what happened next. For each event record: symbol, timeframe, broker timezone, level source, high/low excursion, closing price, reaction classification, invalidation, trading costs and whether you would stand aside. Include at least one case of acceptance and one inconclusive case.
Instructor review criterion: 100% of levels defined without future information; correct buy/sell stop-side labelling; clear distinction between observation and inference; no claim of guaranteed outcome; coherent risk and no-trade logic. Instructor sign-off is not yet enabled on this beta page.
The technical distinction between executable quoted depth, latent liquidity and conditional stop orders is informed by publicly available market-structure references:
Educational concepts and synthetic examples only. No live data, broker-specific execution promise, statistically validated entry signal, investment recommendation or guaranteed trading result.