Risk-first learningIndependent practiceNo membership or sign-in required
Independent student audit copy. This revised Student Edition is still under instructor and learner review. The questions are formative only; formal grades and private answer keys are not available here.
FOREX VISUAL LAB · C01.1
Higher highs. Higher lows.
Identifying confirmed swing structure
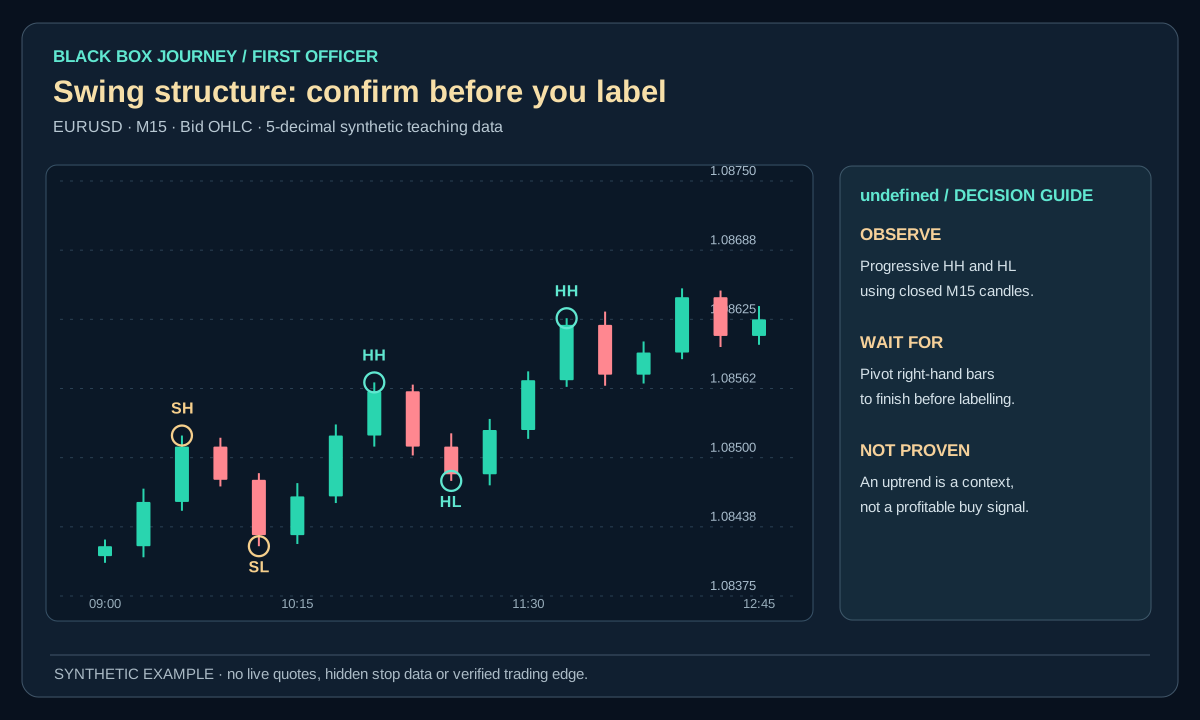
EURUSD · M15 · BID
What the candles show
Two progressively higher confirmed swing highs and higher lows describe a rising sequence. They do not promise the next candle will rise.
Important distinction
The higher low matters only once enough later candles have closed to confirm it. Never draw the pivot at its historical location as if it was known immediately.
No buy signal is implied. Structure is descriptive context. Five-decimal quotes and labels follow EURUSD conventions; broker feed conventions vary.
First Officer · C01: Market Structure · About 25–30 minutes
Safety rule: A chart label is not a forecast. Define your failure point and cash loss before considering any trade.
Your mission today
By the end you can mark confirmed swing highs and lows without using candles from the future.
Before you start
Complete Second Officer and have an H4, H1 or M15 demo chart with replay. Use a paper worksheet for every example. All numbers below are imaginary educational figures.
1. See the idea clearly
A mountain trail has small bumps and major peaks. On a price chart, a swing high is a confirmed local peak and a swing low is a confirmed local trough. The important word is confirmed. A rule that needs two candles on the right cannot know its result until those candles close.
A swing is a local turning point selected by an explicit rule, not every tiny candle wiggle. A sequence of higher highs and higher lows describes an upward auction; lower highs and lower lows describe a downward one. Structure depends on the timeframe and the swing definition. A five-minute uptrend may be a pullback within an hourly downtrend.
2. Worked example: loss before gain
Imagine confirmed highs at 100, 105 and 109 and lows at 94, 98 and 103. A long entered at 107 with a protective stop at 102.5 has 4.5 points of planned downside. On an imaginary contract worth $2 per point, that is −$9 before fees. A later rise to 111 could create +$8, but it is not guaranteed.
Open the diagram for full-size detail on a mobile screen. All illustrated prices are synthetic unless explicitly sourced as historical market data.
Original Black Box Journey schematic. Imaginary numbers; not a validated market strategy.
BLACK BOX JOURNEY · LESSON VISUAL WORKSHOP
See the concept, the decision and the mistake
3 original teaching figures for lesson C01.1. Read each panel in order and compare the chart, calculation or decision with the explanation above. Tap Expand for a full-size review. Diagrams and prices are classroom illustrations, not live market records or validated trading signals.
Loading 3 teaching visuals…
3. Apply a repeatable method
Write the pivot width before inspecting a chart. Identify the last two confirmed highs and lows. Mark the higher low that a continuation hypothesis depends on. A local five-minute dip does not automatically break a protected hourly swing. Give the actual closing condition required for a change in your map.
Technical detail from the preserved source: Define pivots using a consistent lookback and only label confirmed pivots after the required bars have closed. This delay is not a defect: it prevents pretending you knew the swing in real time. Distinguish protected swing levels from minor internal noise and write the exact breach that would invalidate your regime map.
4. Know when the explanation fails
A pivot marker plotted on an earlier bar can mislead: confirmation happens only after right-hand bars have closed. An unconfirmed swing can disappear. Record the first timestamp when the signal existed; redraw nothing after seeing the next move.
Redrawing pivots after seeing the outcome creates hindsight bias. An unconfirmed pivot may disappear if price continues higher, and a break of a tiny internal low need not reverse the hourly trend.
5. Practise without the advantage of hindsight
Start with one five-bar paper example. Suppose bar 3 makes a potential high of 105, then bars 4 and 5 close with highs of 103 and 102. If your pivot rule needs two complete bars on the right with lower highs, the high at bar 3 becomes confirmed only when bar 5 closes. Before bar 5 closes it is just a candidate. Mark both timestamps on your paper chart.
Now compare an invalid candidate: if bar 5's high had instead reached 106, bar 3 would not qualify under this declared rule. Practise declaring WAIT rather than moving the pivot marker after seeing the next bar. A single example never proves an earnings method; the independent ten-case exercise below tests whether you can apply the rule.
6. Mark when a swing was knowable, not just where it appears
Synthetic five-bar exercise: Assume a pivot-high rule requires two completed candles on each side of a candidate high. Bars 1 and 2 have lower highs than 1.08600. Bar 3 reaches that candidate high. Bars 4 and 5 also have lower highs, so the candidate becomes confirmed when bar 5 closes, not at bar 3. If bar 5 instead reached 1.08620, the original high would not qualify. The chart may draw the symbol above bar 3 afterwards, but your decision record must use bar 5's close time.
Now imagine a student buying at Ask 1.08550 with a Bid stop at 1.08450. That is 10 pips of planned risk, or −$10 on an invented $1-per-pip size if filled at the stop, before costs. A later Bid at 1.08650 would yield +10 pips in another possible path. Whether the pivot was confirmed at entry time matters more than whether this one trade won.
Replay task: Pause at each completed candle. Record the candidate high, the confirmation candle, the protected low and any event that cancels the map. If the next required candle has not closed, label the swing UNCONFIRMED and choose WAIT.
Common mistake
A charting platform may draw a pivot marker above the turning candle even though two later candles were needed to confirm it. In replay, record both the pivot candle time and the first time the pivot was actually knowable. An entry dated earlier than confirmation is not a valid historical decision.
Plain-English glossary
Swing high: A local high confirmed by a declared rule.
Swing low: A local low confirmed by a declared rule.
Higher low: A confirmed low above an earlier low.
Pivot delay: The time needed for later bars to confirm a candidate turning point.
Try it yourself
Draw ten swing maps on closed candles. For each candidate, write the pivot rule, the bar when it became confirmed, the protected low or high and one hypothetical no-trade reason. Save the initial chart, rule, decision timestamp and failure condition in your journal.
PRACTISE · TEST YOUR UNDERSTANDING
Quick check
Select an answer or type your own for each question. Press Submit practice to review the five responses. This is a formative beta exercise, not a graded assessment.
0 / 5 answered
Answer all 5 questions to submit.
What you can now do
Mark confirmed swing highs and lows without using candles from the future.
State what observation would make the idea invalid.
Produce an independent closed-bar decision record.
Next lesson
C01.2 · Trend, Range and Transition. Carry forward the same evidence and risk-first habits.
Student clarity check
Could you explain the idea in your own words, reproduce the calculation and complete the exercise without seeing an instructor's answer? Does the diagram actually show the concept? Please record exact lesson codes and specific points of confusion for the independent Claude audit.