Risk-first learningIndependent practiceNo membership or sign-in required
Independent student audit copy. This revised Student Edition is still under instructor and learner review. The questions are formative only; formal grades and private answer keys are not available here.
FOREX VISUAL LAB · C01.2
A range is an observed zone.
Repeated tests between two boundaries
EURUSD · M15 · BID
What the candles show
EURUSD rotates between a prior upper and lower zone. A drawn boundary is an observation, not an order or a guarantee.
Important distinction
The teaching boundaries are 1.08440 (lower) and 1.08510 (upper). Candles remain within both in this example.
Do not change historical boundaries just to make a later trade look successful. Five-decimal quotes and labels follow EURUSD conventions; broker feed conventions vary.
First Officer · C01: Market Structure · About 25–30 minutes
Safety rule: A chart label is not a forecast. Define your failure point and cash loss before considering any trade.
Your mission today
By the end you can distinguish a trend, a range and an uncertain transition using completed price swings.
Before you start
Complete Second Officer and have an H4, H1 or M15 demo chart with replay. Use a paper worksheet for every example. All numbers below are imaginary educational figures.
1. See the idea clearly
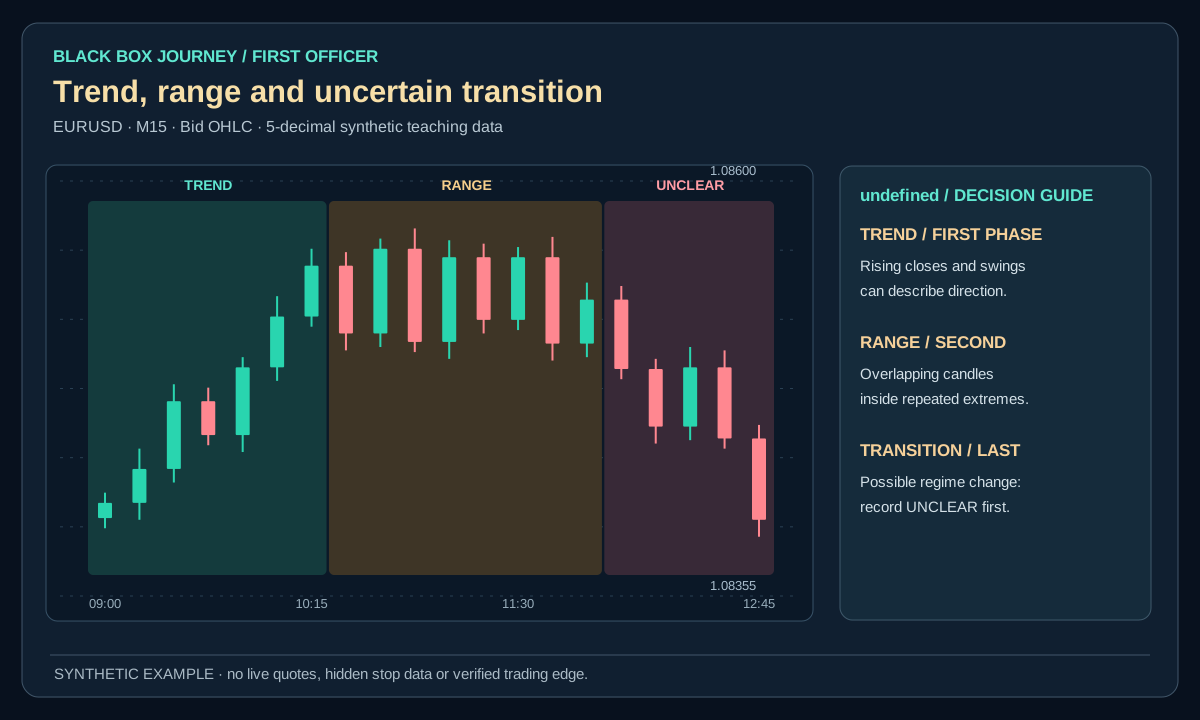
Think of a car driving uphill, circling a car park or turning onto another road. A chart may trend, move sideways within a range, or pass through an uncertain transition. The labels describe past price behaviour, not what must happen next.
Markets alternate among directional, balanced and transitional behaviour. Regime classification is an operational assumption, not a permanent label. In a trend, continuation setups may align with persistent pressure; in a range, chasing one side near the middle often gives poor location. Transitions are especially costly for strategies that keep assuming yesterday's regime.
2. Worked example: loss before gain
An imaginary index climbs 120 points, then spends several hours moving between 2050 and 2065. A long entry at 2064 with a stop at 2058 risks 6 points. At $3 per point that is −$18 before costs. A later move to 2070 could gain $18, but a range breakout may fail instead.
Open the diagram for full-size detail on a mobile screen. All illustrated prices are synthetic unless explicitly sourced as historical market data.
Original Black Box Journey schematic. Imaginary numbers; not a validated market strategy.
BLACK BOX JOURNEY · LESSON VISUAL WORKSHOP
See the concept, the decision and the mistake
3 original teaching figures for lesson C01.2. Read each panel in order and compare the chart, calculation or decision with the explanation above. Tap Expand for a full-size review. Diagrams and prices are classroom illustrations, not live market records or validated trading signals.
Loading 3 teaching visuals…
3. Apply a repeatable method
For a trend, ask whether confirmed highs and lows are progressing in one direction. For a range, mark repeated reactions near both boundaries with overlap between candles. For transition, explicitly write UNCLEAR. Do not classify one whole day as trending when the recent closed candles show a different condition.
Technical detail from the preserved source: Use the distance between recent swing extremes, overlap of candles and direction of closes to identify broad conditions. Write an 'unclear' category instead of forcing every chart into bull or bear. Regime filters must be tested without access to future bars and need to be simple enough to apply live.
4. Know when the explanation fails
A trend label is an observation and cannot guarantee tomorrow's direction. Changing the number of bars or indicator settings after every losing trade can make the past fit an invented story. Freeze the classification rule before testing it.
Adding indicators until every previous trade fits a favourite regime is curve-fitting. A range can become a trend in one news release; classification alone is not a forecast.
5. Practise without the advantage of hindsight
Find five trending, five ranging and five unclear synthetic examples. Write the exact observations supporting each label, and do not turn the labels directly into Buy/Sell commands.
The result of a single example never proves an earnings method. Keep both rejected and eligible observations. Evaluate the decision using information available then, not later candles.
6. Tell a real transition from a noisy candle
Synthetic EURUSD comparison: Sequence A has confirmed highs of 1.08500, 1.08600 and 1.08700 and confirmed lows of 1.08200, 1.08300 and 1.08400. That fits a rising swing structure under one consistent pivot rule. Sequence B has repeated turns near 1.08400 and 1.08600, but no sustained progress outside those bounds. It may be a range rather than a trend. Sequence C breaks below the latest protected low. It is a possible transition, not instant proof of a downtrend.
The same small M15 decline can appear inside a rising H4 structure. Write both timeframes before applying a label. For an imaginary long at Ask 1.08500 with a Bid stop at 1.08350, the 15-pip planned price risk would be −$15 at $1 per pip before costs. An imagined later Bid at 1.08700 would give +20 pips, but neither a trend label nor a range label promises that move.
Replay task: Build a three-row ledger for TREND, RANGE and TRANSITION. Record the last two confirmed highs, the last two confirmed lows, the timeframe and the next observation needed to change your label. Do not rename a failed breakout as an obvious range after seeing it fail.
Common mistake
Imagine a student sees price rally later and retroactively labels the earlier sideways candles as a trend. That makes every past chart look tidy but creates a rule nobody could follow live. Write the trend-versus-range criteria first, then keep the labels produced at each decision timestamp.
Plain-English glossary
Trend: A persistent directional pattern of confirmed swings.
Range: Price oscillation between observed areas.
Transition: A period when prior structure no longer clearly describes current action.
Overlap: Several candles trading within similar price regions.
Try it yourself
Find five trending, five ranging and five unclear synthetic examples. Write the exact observations supporting each label, and do not turn the labels directly into Buy/Sell commands. Save the initial chart, rule, decision timestamp and failure condition in your journal.
PRACTISE · TEST YOUR UNDERSTANDING
Quick check
Select an answer or type your own for each question. Press Submit practice to review the five responses. This is a formative beta exercise, not a graded assessment.
0 / 5 answered
Answer all 5 questions to submit.
What you can now do
Distinguish a trend, a range and an uncertain transition using completed price swings.
State what observation would make the idea invalid.
Produce an independent closed-bar decision record.
Next lesson
C01.3 · Support, Resistance and Reaction Zones. Carry forward the same evidence and risk-first habits.
Student clarity check
Could you explain the idea in your own words, reproduce the calculation and complete the exercise without seeing an instructor's answer? Does the diagram actually show the concept? Please record exact lesson codes and specific points of confusion for the independent Claude audit.