Risk-first learningIndependent practiceNo membership or sign-in required
Independent student audit copy. This revised Student Edition is still under instructor and learner review. The questions are formative only; formal grades and private answer keys are not available here.
First Officer · C01: Market Structure · About 25–30 minutes
Safety rule: A chart label is not a forecast. Define your failure point and cash loss before considering any trade.
Your mission today
By the end you can draw a defensible support or resistance area and state where the price idea would fail.
Before you start
Complete Second Officer and have an H4, H1 or M15 demo chart with replay. Use a paper worksheet for every example. All numbers below are imaginary educational figures.
1. See the idea clearly
A shop may sell many items at prices near RM10 rather than exactly RM10. Trading reactions also cluster around zones instead of perfect lines. Support is an area where price previously found buying interest. Resistance is an area where it previously met selling interest. Neither guarantees another reaction.
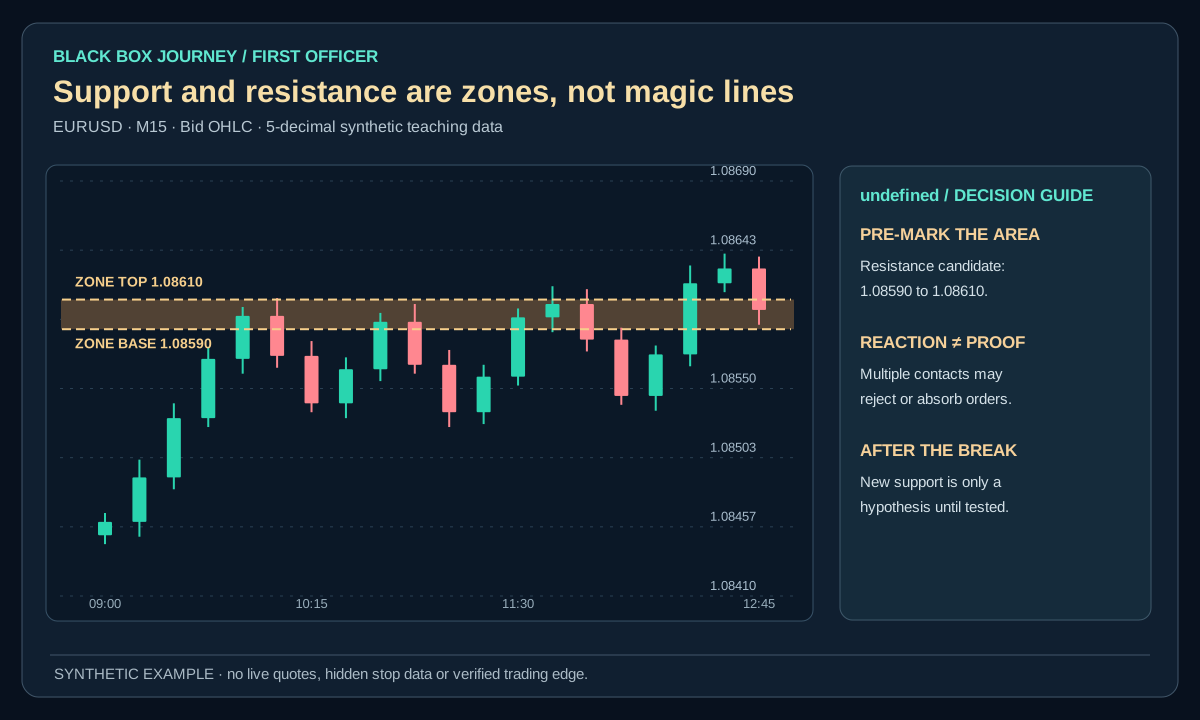
Reaction areas are better treated as zones with a price distribution than precise magical numbers. Their quality depends on how often price responded, how recently they were tested, and whether the market has accepted prices through them. A former resistance area can act as reference support, but the so-called role reversal can fail.
2. Worked example: loss before gain
An imaginary gold chart previously reacts around $2,520. A long at $2,522 with a planned exit at $2,516 has a $6 adverse price distance. Under a teaching contract of 10 ounces, that is −$60 before costs. A move to $2,530 could give +$80, but the old reaction is not proof of future buying.
Open the diagram for full-size detail on a mobile screen. All illustrated prices are synthetic unless explicitly sourced as historical market data.
Original Black Box Journey schematic. Imaginary numbers; not a validated market strategy.
BLACK BOX JOURNEY · LESSON VISUAL WORKSHOP
See the concept, the decision and the mistake
3 original teaching figures for lesson C01.3. Read each panel in order and compare the chart, calculation or decision with the explanation above. Tap Expand for a full-size review. Diagrams and prices are classroom illustrations, not live market records or validated trading signals.
Loading 3 teaching visuals…
3. Apply a repeatable method
Mark actual clusters of completed candle highs, lows and closes. Choose a consistent method to set zone width and explain the choice. Label the price condition that would invalidate the trade hypothesis. A resistance area becoming a proposed support after a break requires fresh acceptance evidence, not merely changing the line colour.
Technical detail from the preserved source: Draw zones around clusters of actual reactions, keeping width consistent with volatility and spread. Distinguish the price level used for an entry from the level that invalidates the underlying idea. More tests do not always mean a level is stronger; repeated absorption may precede a break.
4. Know when the explanation fails
If a zone is so wide that nearly any future reversal can be called a touch, it is not a useful rule. Multiple tests do not guarantee strength; repeated buying or selling can absorb available orders before a break. Record rejected reactions as well as successes.
Drawing dozens of broad zones guarantees that every reversal appears 'at a level'. A support line drawn after the bounce is explanation, not predictive evidence.
5. Practise without the advantage of hindsight
On five replay charts, mark no more than two key zones each. Justify their boundaries, a plausible failure level and an example where price ignored the level. Record the first known timestamp.
The result of a single example never proves an earnings method. Keep both rejected and eligible observations. Evaluate the decision using information available then, not later candles.
6. Turn a drawn line into a testable price area
Synthetic EURUSD example: Suppose completed H1 candles reversed near 1.08600, 1.08590 and 1.08610. Rather than pretending one price is magical, mark a resistance area from 1.08590 to 1.08610. Its width is 2 pips. A candle trading at 1.08605 has visited that area; it has not proved a breakout. A completed close above 1.08610 might qualify only if that was your prewritten rule.
For a separate imaginary short opened at Bid 1.08580 with a planned Ask stop at 1.08630, the stop distance is 5 pips. At $1 per pip, the planned price loss is −$5 before costs or worse fills. A later Ask at 1.08480 would produce +10 pips in a different hypothetical path. Neither outcome establishes that the zone controls future prices.
Replay task: Draw two support and two resistance areas using only completed reactions. Write the first timestamp each boundary was available, its measured width, and what would invalidate the idea. Record one case where price crossed the zone and returned. The purpose is to describe interactions, not to guess unseen orders.
Common mistake
Imagine a student widens a support zone after the next bounce so the reversal falls inside it. A level that moves whenever the market moves cannot be tested. Mark the zone edges before the next touch and record both reactions that hold and reactions that fail.
Plain-English glossary
Support: An area of earlier price reactions below or near price.
Resistance: An area of earlier selling reactions.
Reaction zone: A price area marked by an explicit method.
Invalidation: Evidence that makes a chosen trade idea no longer valid.
Try it yourself
On five replay charts, mark no more than two key zones each. Justify their boundaries, a plausible failure level and an example where price ignored the level. Record the first known timestamp. Save the initial chart, rule, decision timestamp and failure condition in your journal.
PRACTISE · TEST YOUR UNDERSTANDING
Quick check
Select an answer or type your own for each question. Press Submit practice to review the five responses. This is a formative beta exercise, not a graded assessment.
0 / 5 answered
Answer all 5 questions to submit.
What you can now do
Draw a defensible support or resistance area and state where the price idea would fail.
State what observation would make the idea invalid.
Produce an independent closed-bar decision record.
Next lesson
C01.4 · Break of Structure and Character Change. Carry forward the same evidence and risk-first habits.
Student clarity check
Could you explain the idea in your own words, reproduce the calculation and complete the exercise without seeing an instructor's answer? Does the diagram actually show the concept? Please record exact lesson codes and specific points of confusion for the independent Claude audit.