Risk-first learningIndependent practiceNo membership or sign-in required
Independent student audit copy. This revised Student Edition is still under instructor and learner review. The questions are formative only; formal grades and private answer keys are not available here.
FIRST OFFICER · EURUSD PRICE ACTION LAB
Evidence, invalidation and the rational skip
Turn an attractive chart into a precise risk decision
EURUSD · M15 · Bid
What the chart actually establishes
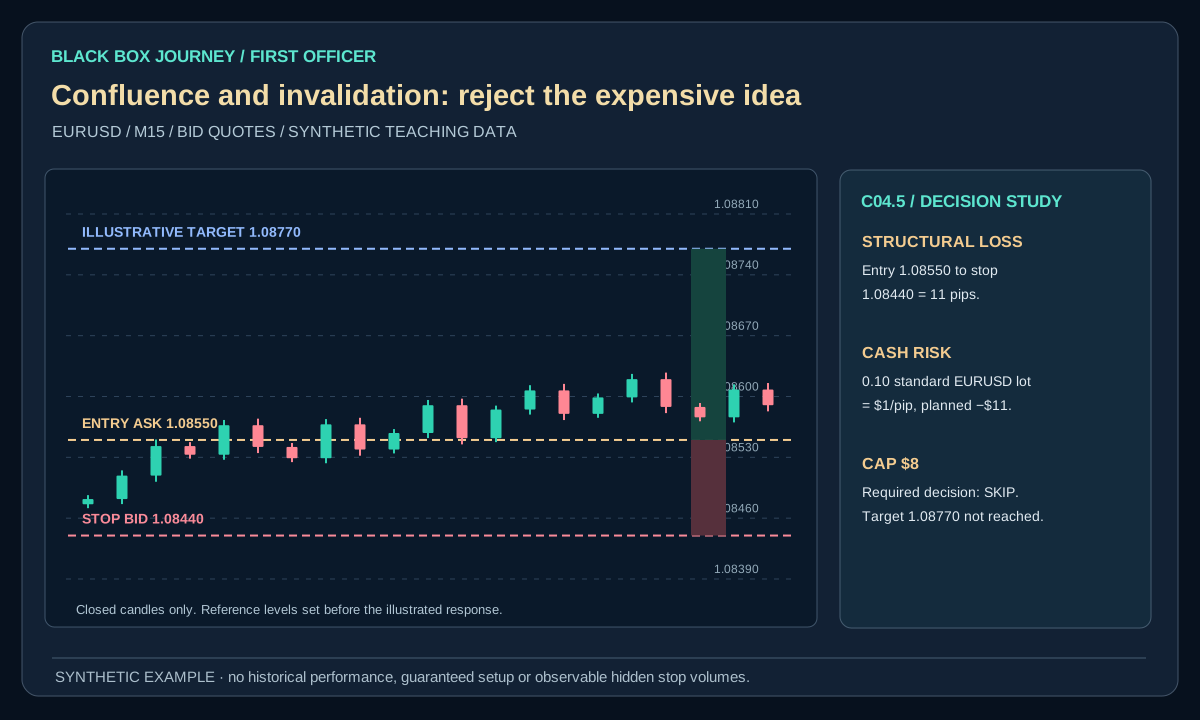
A hypothetical long at Ask 1.08550, stop at Bid 1.08440 and 2R target at Bid 1.08770 is 11 pips of planned downside versus 22 pips of hypothetical upside before additional costs.
What not to assume
A trade fitting an imaginary budget is not an entry signal. The target is not reached here and the stop can slip.
First Officer · C04: Zones, Liquidity and Patterns · About 25–30 minutes
Safety rule: Confluence can improve description, but a crowded chart cannot prove an earnings edge.
Your mission today
By the end you can score a candidate setup on five risk-aware quality checks without inventing a win probability.
Before you start
Complete C03, have a demo chart with replay and write your risk cap. All illustrative figures are imaginary, never historical results.
1. Understand the concept
Start with one clear observation
For example, price has reacted several times in a previously marked zone. State what you can actually see. Do not confuse a visible reaction with evidence that a known institution is buying.
Add one independently useful trigger
A trigger is a specific condition that would prompt the next decision, such as a completed candle closing above a prior swing level. Indicators built from the same price candles may offer another view but not independent proof.
Say what would prove you wrong
An invalidation condition is a predefined reason to abandon the idea. If the zone clearly fails or price closes below a chosen structural low, the story changes. A stop-loss order is an execution tool; during gaps and fast markets it does not guarantee the exact filled price.
2. Worked example: show the loss first
In the EURUSD chart lab, a fictional long opens at Ask 1.08550 with a structural invalidation stop at Bid 1.08440. The planned distance is 11 pips. At 0.10 standard EURUSD lot ($1 per pip), the price risk is −$11 before additional costs or a worse fill.
A hypothetical 2R profit target at Bid 1.08770 sits 22 pips above entry. It is not reached in the shown candles and is not a prediction. If the student's imaginary per-trade cap is $8, the appropriate decision is SKIP, regardless of how many indicators agree. With a $15 cap, the arithmetic may fit, but that alone still cannot validate the entry.
Open the diagram for full-size detail on a mobile screen. All illustrated prices are synthetic unless explicitly sourced as historical market data.
Original Black Box Journey instructional diagram. All numbers hypothetical.
BLACK BOX JOURNEY · LESSON VISUAL WORKSHOP
See the concept, the decision and the mistake
3 original teaching figures for lesson C04.5. Read each panel in order and compare the chart, calculation or decision with the explanation above. Tap Expand for a full-size review. Diagrams and prices are classroom illustrations, not live market records or validated trading signals.
Loading 3 teaching visuals…
3. Apply the method
Make the risk measurable
If hypothetical entry is 105 and stop is 99, the stop distance is 6 price units. That number alone is not the account risk: contract size, instrument specifications, fees and slippage determine the cash amount. A trader chooses position size from the intended cash risk, not the other way around.
Grade the process separately from the profit
A profitable rule violation is still a rule violation. A losing trade that followed a sound, tested plan is still useful feedback. Review a meaningful sequence of outcomes, including trading costs, rather than demanding that every example end in profit.
4. Know when the idea fails
Use a five-point checklist: (1) level marked in advance, (2) closed trigger visible, (3) meaningful invalidation, (4) size fits cash risk, (5) room to first obstacle after costs. Any critical risk failure means SKIP, regardless of total score.
Using five near-identical indicators to fabricate “five confirmations,” hiding stop losses, or judging every entry solely by whether it won.
5. Do it without hindsight
Write a four-line hypothetical trade plan: the observed level, an exact candle-close trigger, the invalidation condition and maximum cash risk. Then test it on a chart you have not inspected beyond the entry.
Before revealing later candles, record the exact boundary, setup failure and reason to TRADE, WAIT or SKIP. The exercise is evidence of learning, not of profitable expectancy.
6. Score the setup without letting a score overrule risk
A quality checklist helps make repeated decisions consistent. Use five questions: (1) Is the exact symbol and contract understood? (2) Is the H4/H1 context defined on completed candles? (3) Is the entry rule observable now? (4) Is the structural stop and cash loss affordable? (5) Are spread, news and session conditions within written limits? Mark each YES, NO or UNKNOWN before discussing an order.
Synthetic comparison: Setup A has four YES answers, but the permitted minimum volume would risk $30 against a $20 cash limit. The correct decision is SKIP, even if the visible pattern looks attractive. Setup B passes every safety condition but has no qualifying entry candle. Its decision is WAIT, not an early order. A checklist is not a vote in which four good items cancel one dangerous item.
For a hypothetical 12-pip stop at an invented $1 per pip, planned price risk is −$12 before extra costs. A 20-pip favourable move would be +$20 in an alternate scenario, but neither the five-point score nor a positive reward-to-risk ratio provides a win probability.
Decision exercise: Review five hidden-future chart cases. For each, save the five answers, TRADE/WAIT/SKIP decision, exact risk calculation and first missing fact. A reviewer should reach the same decision using only the information you had.
Common mistake
Using five near-identical indicators to fabricate “five confirmations,” hiding stop losses, or judging every entry solely by whether it won. State the corrective rule in your own words before the next replay.
Plain-English glossary
Confluence: Several observations supporting one hypothesis.
Invalidation: The condition that proves a setup no longer qualifies.
Trade quality: A process score under a written checklist.
Reward-to-risk: Proposed price upside divided by planned price downside.
Try it yourself
Write a four-line hypothetical trade plan: the observed level, an exact candle-close trigger, the invalidation condition and maximum cash risk. Then test it on a chart you have not inspected beyond the entry. Keep the full offered set, including failed and skipped cases.
PRACTISE · TEST YOUR UNDERSTANDING
Quick check
Select an answer or type your own for each question. Press Submit practice to review the five responses. This is a formative beta exercise, not a graded assessment.
0 / 5 answered
Answer all 5 questions to submit.
What you can now do
Score a candidate setup on five risk-aware quality checks without inventing a win probability.
Calculate a planned loss before discussing upside.
Explain how the chart idea could fail.
Next lesson
C05.1 · Top-Down Analysis: H4 → H1 → M15.
Student clarity check
Could you explain the idea in your own words, reproduce the calculation and complete the exercise without seeing an instructor's answer? Does the diagram actually show the concept? Please record exact lesson codes and specific points of confusion for the independent Claude audit.