Risk-first learningIndependent practiceNo membership or sign-in required
Independent student audit copy. This revised Student Edition is still under instructor and learner review. The questions are formative only; formal grades and private answer keys are not available here.
FIRST OFFICER · EURUSD PRICE ACTION LAB
A breakout that returns inside
Separate a closed-bar breakout from later acceptance
EURUSD · M15 · Bid
What the chart actually establishes
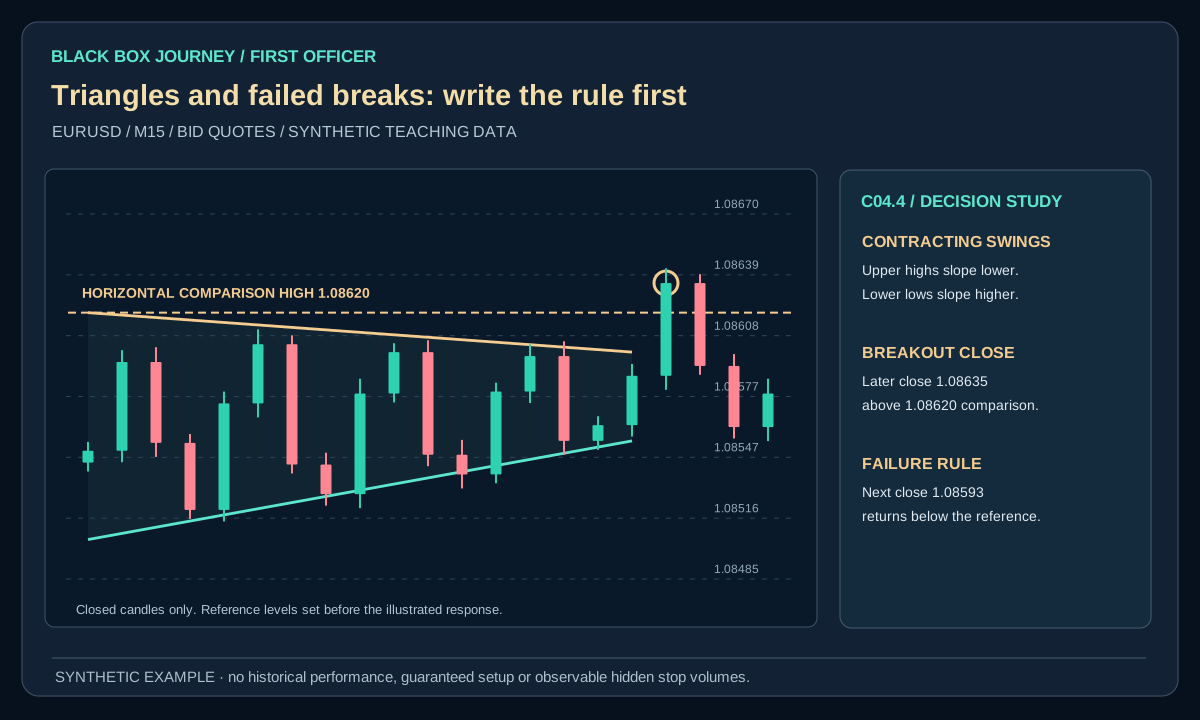
EURUSD closes above the earlier 1.08620 ceiling, then the following completed candle returns below it. A close-based breakout can fail.
What not to assume
Do not discard unsuccessful breaks in hindsight or assume one bar above a line proves continuation.
First Officer · C04: Zones, Liquidity and Patterns · About 25–30 minutes
Safety rule: A chart pattern is an observation of past swings, not a prediction or a licence to ignore stops.
Your mission today
By the end you can describe triangles, flags and double tops or bottoms using prewritten chart rules.
Before you start
Complete C03, have a demo chart with replay and write your risk cap. All illustrative figures are imaginary, never historical results.
1. Understand the concept
What chart patterns really are
A pattern is a simplified description of earlier price action. It may help traders organise observations, but it does not control where prices go next. Two people may draw its lines slightly differently.
The triangle example
A converging triangle has upper turning points that tend to fall and lower turning points that tend to rise. The range between them narrows. Mark these turning points first, then draw your guides using information visible at the time.
Define a breakout without moving the goalposts
For example: “A completed candle closes above the upper line.” A stricter rule might require a second close or a retest. Whatever you choose, specify it before seeing whether the setup worked.
2. Worked example: show the loss first
Consider a synthetic EURUSD range with a pre-defined upper boundary of 1.08620. A completed candle closes beyond it, and a hypothetical breakout long then fills at Ask 1.08635, with a stop at Bid 1.08595. The planned distance is 4 pips. At 0.20 standard EURUSD lot ($2 per pip), that is −$8 price risk before separate fees or slippage. An executable Bid rising to 1.08695 would give +6 pips or +$12, but the next closed candle might instead return below 1.08620.
The interactive chart demonstrates the failed-breakout case. A triangle with converging highs and lows is a different pattern to practise separately; the same warning applies: crossing a drawn guide is not proof of continuation.
Open the diagram for full-size detail on a mobile screen. All illustrated prices are synthetic unless explicitly sourced as historical market data.
Original Black Box Journey instructional diagram. All numbers hypothetical.
BLACK BOX JOURNEY · LESSON VISUAL WORKSHOP
See the concept, the decision and the mistake
3 original teaching figures for lesson C04.4. Read each panel in order and compare the chart, calculation or decision with the explanation above. Tap Expand for a full-size review. Diagrams and prices are classroom illustrations, not live market records or validated trading signals.
Loading 3 teaching visuals…
3. Apply the method
Define a failure just as clearly
For example: “The next completed candle closes back inside the triangle.” A false breakout happens when an apparent move beyond a boundary does not hold. Some breakouts fail immediately, others after several candles.
Measured targets and reality
Some traders estimate a potential distance using the triangle’s height. That is a chart convention, not a promise. Risk, market structure, volatility and data quality matter more than a neat projected arrow.
4. Know when the idea fails
This lesson focuses on recognising and measuring chart patterns. The mechanics of false breakouts were covered in C02.4; use that lesson for failure classification rather than repeating it here.
Drawing arbitrary lines until a triangle appears, confusing a wick outside a pattern with a sustained break, and showing only the breakout examples that succeed.
5. Do it without hindsight
Draw two trendlines through visible prior turning points, define a valid breakout close and a failure close, then reveal more candles without changing the rules.
Before revealing later candles, record the exact boundary, setup failure and reason to TRADE, WAIT or SKIP. The exercise is evidence of learning, not of profitable expectancy.
6. Tell a triangle, a flag and a double top apart
Synthetic EURUSD chart exercise: A triangle may have three completed highs at 1.08600, 1.08570 and 1.08540 while its lows rise from 1.08300 to 1.08350 and 1.08400. Its narrowing space is observable; the direction of the next move is not. A flag instead follows a clearly defined prior impulse and then forms a smaller, often sloping consolidation. A double top uses two nearby highs under a fixed tolerance, with a separate neckline rule. Two highs alone do not establish a reversal.
Suppose a hypothetical triangle breakout buy fills at Ask 1.08560 with a Bid stop at 1.08470. That is 9 pips of planned price risk, or −$9 on an imaginary $1-per-pip position before costs. A simple projected height might suggest a potential objective, but it supplies no probability. A return inside the triangle may invalidate the idea before any target is reached.
Decision exercise: Label three anonymous chart sketches as TRIANGLE, FLAG, DOUBLE TOP or NONE. Under each label write the swing anchors, the required completed-candle condition and one reason to skip. Keep rejected patterns in your journal. Otherwise your pattern statistics will quietly exclude the hardest examples.
Common mistake
Drawing arbitrary lines until a triangle appears, confusing a wick outside a pattern with a sustained break, and showing only the breakout examples that succeed. State the corrective rule in your own words before the next replay.
Plain-English glossary
Triangle: Converging highs and lows in a chart pattern.
Flag: A small consolidation after an earlier directional move.
Double top: Two nearby highs under an explicit matching rule.
Breakout: A qualified move beyond a premarked boundary.
Try it yourself
Draw two trendlines through visible prior turning points, define a valid breakout close and a failure close, then reveal more candles without changing the rules. Keep the full offered set, including failed and skipped cases.
PRACTISE · TEST YOUR UNDERSTANDING
Quick check
Select an answer or type your own for each question. Press Submit practice to review the five responses. This is a formative beta exercise, not a graded assessment.
0 / 5 answered
Answer all 5 questions to submit.
What you can now do
Describe triangles, flags and double tops or bottoms using prewritten chart rules.
Calculate a planned loss before discussing upside.
Explain how the chart idea could fail.
Next lesson
C04.5 · Confluence, Invalidation and Trade Quality.
Student clarity check
Could you explain the idea in your own words, reproduce the calculation and complete the exercise without seeing an instructor's answer? Does the diagram actually show the concept? Please record exact lesson codes and specific points of confusion for the independent Claude audit.