Risk-first learningIndependent practiceNo membership or sign-in required
Independent student audit copy. This revised Student Edition is still under instructor and learner review. The questions are formative only; formal grades and private answer keys are not available here.
FIRST OFFICER · EURUSD PRICE ACTION LAB
Fibonacci from a confirmed swing
Calculate retracements from completed swing endpoints
EURUSD · M15 · Bid
What the chart actually establishes
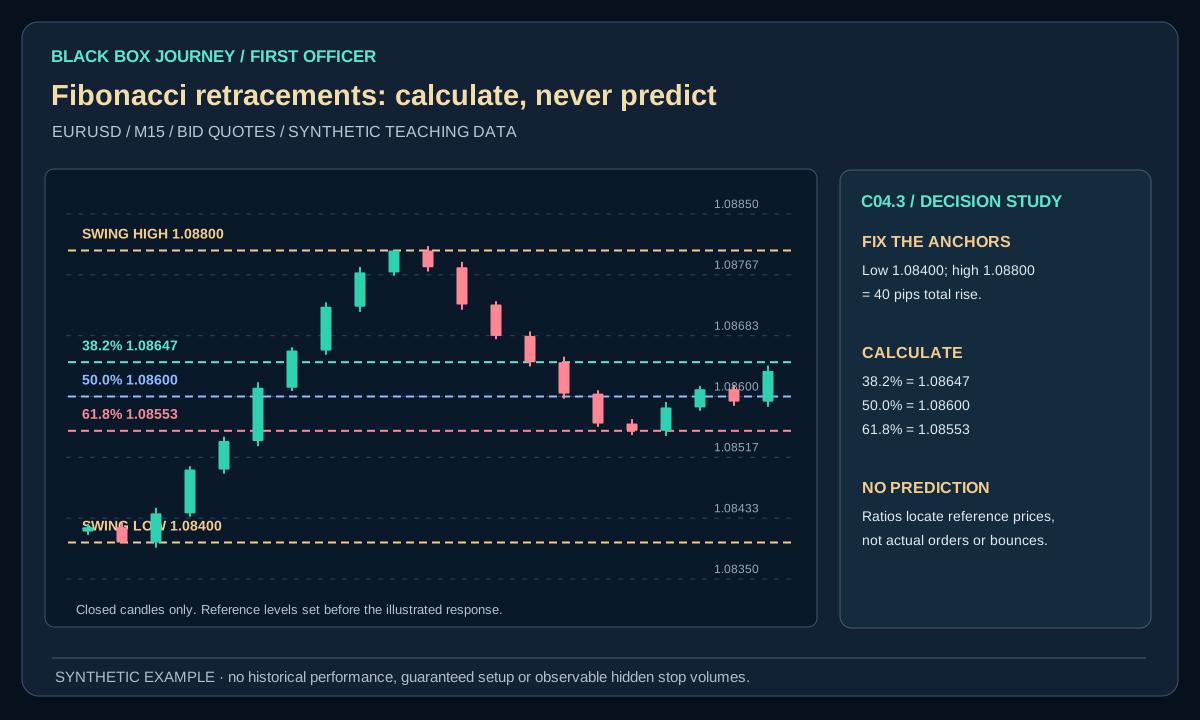
After both swing extremes have formed, the 38.2%, 50.0% and 61.8% prices can be calculated exactly. The lines describe a prior move.
What not to assume
A Fibonacci line by itself has no guaranteed reaction, entry or profit probability.
First Officer · C04: Zones, Liquidity and Patterns · About 25–30 minutes
Safety rule: A Fibonacci ratio is a calculated reference, not a protective order or guaranteed reversal.
Your mission today
By the end you can calculate Fibonacci retracement prices from fixed swing anchors and explain their limits.
Before you start
Complete C03, have a demo chart with replay and write your risk cap. All illustrative figures are imaginary, never historical results.
1. Understand the concept
What does “retracement” mean?
A retracement is a movement back against an earlier move. If price rose from 100 to 120 and then dipped to 112, the market retraced part of that rise. The retracement percentage measures the size of the pullback relative to the earlier move.
Choose anchors that existed at the time
For an upward price move, choose a visible swing low and swing high. Once chosen, do not shift those anchors after seeing future candles just to make the levels look successful. The location of every percentage line depends on these two observations.
Work through the arithmetic
An EURUSD upward move from 1.08400 to 1.08800 covers 40 pips. A 38.2% retracement is 15.28 pips from the high, giving 1.08647 after rounding to five decimals. A 50% retracement is 20 pips, giving 1.08600. A 61.8% retracement is 24.72 pips, giving 1.08553. A downward move is measured in the opposite direction.
2. Worked example: show the loss first
On the EURUSD example chart, a completed upward swing runs from 1.08400 to 1.08800, a move of 40 pips. The 38.2% retracement is 1.08800 − (0.382 × 0.00400) = 1.08647 when rounded to five decimals. The 50% level is 1.08600; the 61.8% level is 1.08553.
Suppose an illustrative long opens at Ask 1.08600 with stop at Bid 1.08540. The planned distance is 6 pips. At 0.20 standard EURUSD lot ($2 per pip), the nominal downside is −$12 before additional costs and adverse execution. A Fibonacci percentage does not guarantee that price bounces from any of these lines.
Open the diagram for full-size detail on a mobile screen. All illustrated prices are synthetic unless explicitly sourced as historical market data.
Original Black Box Journey instructional diagram. All numbers hypothetical.
BLACK BOX JOURNEY · LESSON VISUAL WORKSHOP
See the concept, the decision and the mistake
3 original teaching figures for lesson C04.3. Read each panel in order and compare the chart, calculation or decision with the explanation above. Tap Expand for a full-size review. Diagrams and prices are classroom illustrations, not live market records or validated trading signals.
Loading 3 teaching visuals…
3. Apply the method
Combine with context, carefully
A retracement level near a previous zone, a trend, or a clearly defined decision area can help organise observation. But multiple lines drawn from the same historical movement are not independent evidence of an edge. Always define the failure scenario.
What Fibonacci cannot tell you
A percentage line does not report actual orders, predict the next candle, or specify a suitable position size. It does not substitute for a tested method, costs, or risk management.
4. Know when the idea fails
Anchor points must have existed at decision time. Changing the high or low after seeing the bounce turns an exercise into hindsight.
Moving swing anchors after the next candles arrive, taking a trade solely because 61.8% was touched, or hiding examples where retracement levels broke.
5. Do it without hindsight
Choose one confirmed low and high from a past impulse, calculate 38.2%, 50%, and 61.8% on paper, and mark them before revealing the subsequent 15 candles.
Before revealing later candles, record the exact boundary, setup failure and reason to TRADE, WAIT or SKIP. The exercise is evidence of learning, not of profitable expectancy.
6. Calculate the retracement, then test whether it matters
Synthetic EURUSD replay: A completed upswing travels from 1.08000 to 1.09000, a distance of 100 pips. A 38.2% pullback from the high is 100 × 0.382 = 38.2 pips, placing the reference at 1.08618. A 61.8% pullback is 61.8 pips, placing the reference at 1.08382. These are arithmetic levels, not barriers that price must respect. They depend on which swing anchors you selected.
Now imagine buying at Ask 1.08620 with a stop at Bid 1.08480. The 14-pip planned risk equals −$14 on an invented $1-per-pip position, before costs or worse fills. A later Bid at 1.08760 would yield +14 pips in a separate possible outcome. Neither the matching arithmetic nor a Fibonacci label predicts which path occurs.
Decision exercise: Mark the completed swing and freeze its two endpoints. Draw the 38.2%, 50% and 61.8% references. Move forward one candle at a time. Record whether price touched, crossed or ignored each line. If two reasonable swing definitions give different prices, note the ambiguity rather than redrawing anchors until the chart looks persuasive.
Common mistake
Moving swing anchors after the next candles arrive, taking a trade solely because 61.8% was touched, or hiding examples where retracement levels broke. State the corrective rule in your own words before the next replay.
Plain-English glossary
Retracement: A movement against a previous move.
Anchor: A chosen starting high or low for measurement.
50% level: The midpoint of the chosen move.
61.8% level: A ratio-based reference within the measured move.
Try it yourself
Choose one confirmed low and high from a past impulse, calculate 38.2%, 50%, and 61.8% on paper, and mark them before revealing the subsequent 15 candles. Keep the full offered set, including failed and skipped cases.
PRACTISE · TEST YOUR UNDERSTANDING
Quick check
Select an answer or type your own for each question. Press Submit practice to review the five responses. This is a formative beta exercise, not a graded assessment.
0 / 5 answered
Answer all 5 questions to submit.
What you can now do
Calculate Fibonacci retracement prices from fixed swing anchors and explain their limits.
Calculate a planned loss before discussing upside.
Explain how the chart idea could fail.
Next lesson
C04.4 · Chart Patterns and False Breakouts.
Student clarity check
Could you explain the idea in your own words, reproduce the calculation and complete the exercise without seeing an instructor's answer? Does the diagram actually show the concept? Please record exact lesson codes and specific points of confusion for the independent Claude audit.