Risk-first learningIndependent practiceNo membership or sign-in required
Independent student audit copy. This revised Student Edition is still under instructor and learner review. The questions are formative only; formal grades and private answer keys are not available here.
FIRST OFFICER · EURUSD PRICE ACTION LAB
A wick-only high-side sweep
Compare the wick with the completed candle close
EURUSD · M15 · Bid
What the chart actually establishes
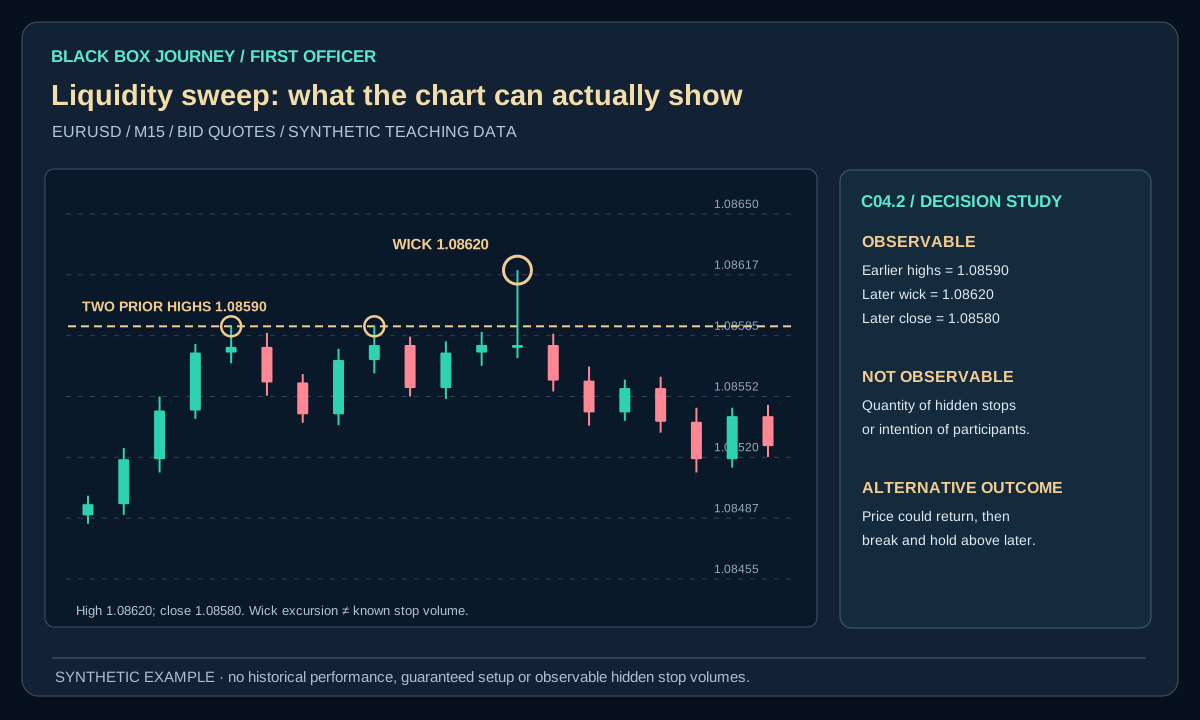
The synthetic EURUSD high exceeds 1.08595, but the finished candle closes back below it. OHLC verifies the breach and close, not hidden stop orders.
What not to assume
The chart alone cannot identify traders who were stopped out or reveal their positions.
First Officer · C04: Zones, Liquidity and Patterns · About 25–30 minutes
Safety rule: Candles show traded or quoted prices, not a complete list of hidden stop orders.
Your mission today
By the end you can distinguish a visible sweep-shaped candle from an unverified claim about hidden stop orders.
Before you start
Complete C03, have a demo chart with replay and write your risk cap. All illustrative figures are imaginary, never historical results.
1. Understand the concept
Where might orders collect?
Traders often place protective stop orders around obvious highs and lows, but we cannot see all those orders on an ordinary candlestick chart. A recent swing high can therefore be an area of interest, not a confirmed map of liquidity.
What a sweep-shaped candle shows
If the candle high rises above a prior high but the candle closes back below it, the market briefly visited and rejected that higher price range during that candle. On a chart, mark the prior high, the later wick above it, and the later close underneath it. These three observations are enough to describe the event.
Wick versus close
The wick represents the highest price seen during that bar. The close is the final price of that period. Both matter. A wick through a level followed by a close underneath looks different from several consecutive closes above it.
2. Worked example: show the loss first
Suppose previous completed EURUSD M15 highs were near 1.08590. A later candle wicks to 1.08620 but closes at 1.08580. That is an observable wick-only breach, not proof of stop hunting. A hypothetical short opened at Bid 1.08580 with invalidation at Ask 1.08620 risks 4 pips. At 0.30 standard EURUSD lot ($3 per pip), the planned price loss is −$12 before extra costs.
If an executable Ask later reached 1.08550, the short would instead show +3 pips or +$9 before costs. An ordinary candle does not reveal the stop orders, trade identities or institutional intentions behind the wick.
Open the diagram for full-size detail on a mobile screen. All illustrated prices are synthetic unless explicitly sourced as historical market data.
Original Black Box Journey instructional diagram. All numbers hypothetical.
BLACK BOX JOURNEY · LESSON VISUAL WORKSHOP
See the concept, the decision and the mistake
3 original teaching figures for lesson C04.2. Read each panel in order and compare the chart, calculation or decision with the explanation above. Tap Expand for a full-size review. Diagrams and prices are classroom illustrations, not live market records or validated trading signals.
Loading 3 teaching visuals…
3. Apply the method
Plan two possible outcomes
Price might fall after a temporary move beyond the level. Or price might pull back briefly and then rally through it. The trader should not call the pattern complete until the relevant candles close and should not assume any one future path is certain.
How to research a sweep idea
Define your level and candle conditions before reviewing results. Count every occurrence including failures, apply realistic spread and execution assumptions, and test out of sample. A visually impressive example is not performance evidence.
4. Know when the idea fails
Record both possibilities before viewing the result: price closes back inside, or it holds outside and continues. Do not label every new high a stop run.
Assuming every long upper wick is manipulation, entering before the candle closes, or selecting only sweeps that happened to reverse later.
5. Do it without hindsight
Mark an obvious high on a chart. Before uncovering later candles, write two alternative paths: price closes back below, or price holds above. Record which actually occurs.
Before revealing later candles, record the exact boundary, setup failure and reason to TRADE, WAIT or SKIP. The exercise is evidence of learning, not of profitable expectancy.
6. Separate an observable sweep from a story about stop orders
Synthetic EURUSD replay: A previous completed H1 high is 1.08600. The next candle reaches 1.08660 but closes at 1.08570. You can verify a wick 6 pips above the old high and a close 3 pips below it. You cannot verify from that candle alone how many stop orders traded or who placed them. Calling it a stop hunt is a hypothesis, not an observed fact.
Consider the risk before any possible reward. An imaginary short opens at Bid 1.08565 and has a stop at Ask 1.08665. That is 10 pips of planned price risk. At $1 per pip, an assumed stop fill would lose −$10, before additional costs. A later executable Ask of 1.08465 would show +10 pips in a different hypothetical path. The same wick could also be followed by another push higher. No future direction follows automatically.
Decision exercise: In chart replay, log ten apparent breaches with the prior level, highest or lowest traded price, closing price and next completed candle. Mark each as WICK ONLY, CLOSE THROUGH or UNKNOWN. Avoid labelling real order-flow events when the data contains only OHLC candles.
Common mistake
Assuming every long upper wick is manipulation, entering before the candle closes, or selecting only sweeps that happened to reverse later. State the corrective rule in your own words before the next replay.
Plain-English glossary
Liquidity: Ability to transact at available prices.
Sweep: A temporary move through a premarked price area.
Wick: A candle extreme outside its open-close body.
Reclaim: A move back through an earlier boundary under a defined rule.
Try it yourself
Mark an obvious high on a chart. Before uncovering later candles, write two alternative paths: price closes back below, or price holds above. Record which actually occurs. Keep the full offered set, including failed and skipped cases.
PRACTISE · TEST YOUR UNDERSTANDING
Quick check
Select an answer or type your own for each question. Press Submit practice to review the five responses. This is a formative beta exercise, not a graded assessment.
0 / 5 answered
Answer all 5 questions to submit.
What you can now do
Distinguish a visible sweep-shaped candle from an unverified claim about hidden stop orders.
Calculate a planned loss before discussing upside.
Explain how the chart idea could fail.
Next lesson
C04.3 · Fibonacci Retracement in Context.
Student clarity check
Could you explain the idea in your own words, reproduce the calculation and complete the exercise without seeing an instructor's answer? Does the diagram actually show the concept? Please record exact lesson codes and specific points of confusion for the independent Claude audit.