Risk-first learningIndependent practiceNo membership or sign-in required
Independent student audit copy. This revised Student Edition is still under instructor and learner review. The questions are formative only; formal grades and private answer keys are not available here.
FIRST OFFICER · EURUSD PRICE ACTION LAB
Supply and demand as price zones
Observe how an earlier reaction area is revisited
EURUSD · M15 · Bid
What the chart actually establishes
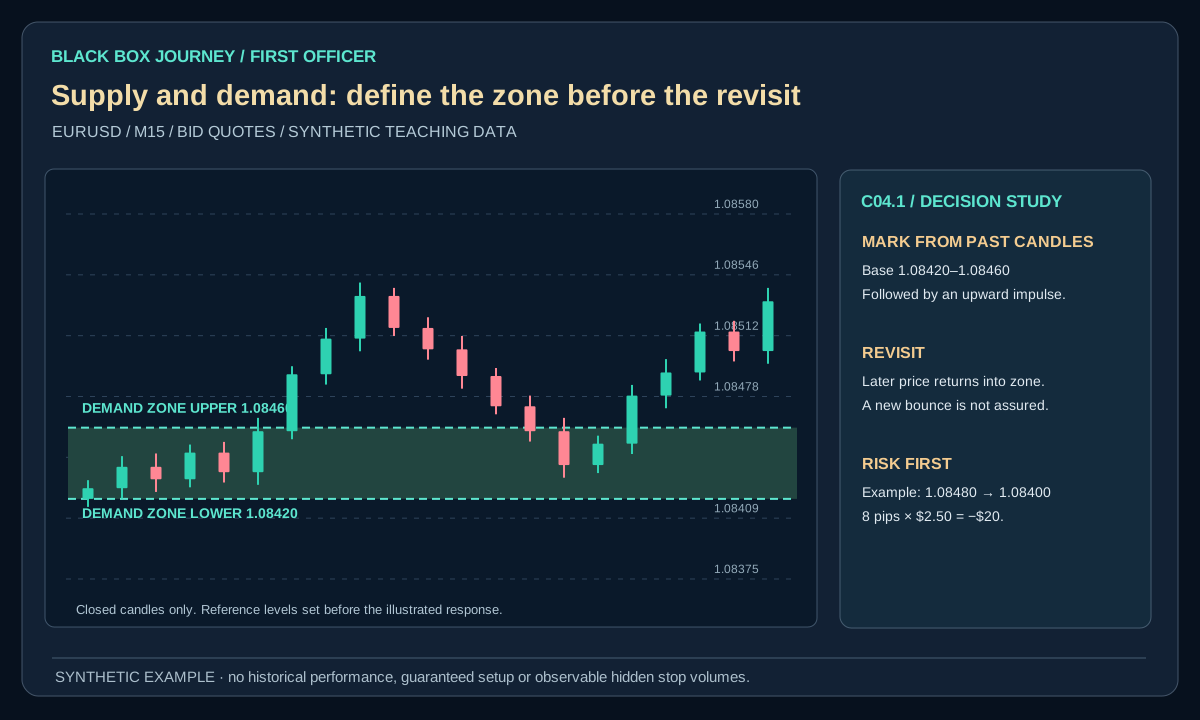
The zones are marked only after the earlier reaction. A return to an observed area is a test of price behaviour, not evidence of institutional orders.
What not to assume
The price may cross any zone. A box is never proof of an unbreakable supply or demand wall.
First Officer · C04: Zones, Liquidity and Patterns · About 25–30 minutes
Safety rule: An earlier reaction is not an entry signal; work out a structural stop before you consider a trade.
Your mission today
By the end you can mark a defensible supply or demand area without assuming price will return or bounce.
Before you start
Complete C03, have a demo chart with replay and write your risk cap. All illustrative figures are imaginary, never historical results.
1. Understand the concept
What is a supply or demand zone?
A demand zone is an area where buying previously helped push price higher. A supply zone is an area where selling previously helped push price lower. We draw an area because trades and quotes did not all happen at one identical price. These are visual descriptions of earlier price behaviour, not proof of the identities or intentions of traders.
How to recognise a zone
First find a relatively compact area of trading. Next check whether price subsequently moved away clearly. Mark the approximate upper and lower edges of that base using candles that had already closed. A zone has more value as a teaching hypothesis when its boundaries are defined before price returns.
Three questions at the revisit
Where did the zone come from? Has price already reacted to it several times? What would count as failure? For a demand zone, trading decisively below the lower boundary may invalidate the original observation; a brief wick alone may not. Define this before seeing the next candles.
2. Worked example: show the loss first
The EURUSD demonstration chart marks an earlier demand reaction around 1.08420–1.08460. Imagine a later long filled at Ask 1.08480, with an invalidation stop at Bid 1.08400. The distance is 8 pips. At a hypothetical 0.25 standard EURUSD lot ($2.50 per pip), the planned price risk is −$20 before commission, slippage or gap risk. A later executable Bid at 1.08540 would yield +6 pips or +$15 before additional costs.
This is a deliberately imperfect reward-to-risk example: a nearby reaction area is not automatic permission to trade. The zone came from earlier completed candles and may fail on the next visit.
Open the diagram for full-size detail on a mobile screen. All illustrated prices are synthetic unless explicitly sourced as historical market data.
Original Black Box Journey instructional diagram. All numbers hypothetical.
BLACK BOX JOURNEY · LESSON VISUAL WORKSHOP
See the concept, the decision and the mistake
3 original teaching figures for lesson C04.1. Read each panel in order and compare the chart, calculation or decision with the explanation above. Tap Expand for a full-size review. Diagrams and prices are classroom illustrations, not live market records or validated trading signals.
Loading 3 teaching visuals…
3. Apply the method
Supply is the opposite case
At a supply zone, look for a former base followed by a meaningful move down. A later rally into the area does not guarantee a fresh decline. Use the same logic in reverse: locate, mark, revisit, observe, invalidate.
Why zones fail
New information, changing liquidity, and competing orders may overwhelm an old reaction area. The first reaction can be shallow, the second can fail, and the zone can become irrelevant. Never widen the original zone retrospectively to make the chart look correct.
4. Know when the idea fails
A zone is a historical observation, not proof of an institution's orders. Draw it before the next candles and include the times it fails.
Drawing a zone only after knowing the later bounce; making it wide enough to explain every move; calling a past reaction proof that institutions will defend it.
5. Do it without hindsight
On a clean chart, mark the last visible base BEFORE revealing the next twenty bars. Note the zone edges. Reveal the bars and label: reaction, break, or unclear.
Before revealing later candles, record the exact boundary, setup failure and reason to TRADE, WAIT or SKIP. The exercise is evidence of learning, not of profitable expectancy.
6. Map a zone without pretending to know the orders behind it
Synthetic EURUSD replay: Suppose two completed H1 candles turn near 1.08400, then several candles close higher. Mark the observed reaction area from 1.08380 to 1.08430. This is a demand candidate, not proof that a bank has buy orders there. Now imagine price returns. A wick entering the area, a close through its lower edge and a strong bounce are three different observations. Write down which one your rule requires before revealing the next candle.
The zone's width is 1.08430 − 1.08380 = 0.00050, or 5 pips. The entry and stop need separate rules. Imagine buying at Ask 1.08445 with a planned Bid stop at 1.08355. That is 9 pips of price risk. At an invented $1 per pip, the loss would be −$9 before costs if filled at that stop. A hypothetical Bid exit at 1.08545 would produce +10 pips, or +$10 before costs. Neither result proves the zone works.
Decision exercise: Draw the area before price returns. Record the earliest bar that establishes it, its exact boundaries, the first retest and the observation that cancels your idea. If you cannot identify these without looking ahead, mark WAIT. A zone is a chart location, not permission to trade.
Common mistake
Drawing a zone only after knowing the later bounce; making it wide enough to explain every move; calling a past reaction proof that institutions will defend it. State the corrective rule in your own words before the next replay.
Plain-English glossary
Supply zone: An area associated with earlier downward price departure.
Demand zone: An area associated with earlier upward price departure.
Revisit: Price returning to a previously drawn area.
Invalidation: A defined observation that defeats the trade idea.
Try it yourself
On a clean chart, mark the last visible base BEFORE revealing the next twenty bars. Note the zone edges. Reveal the bars and label: reaction, break, or unclear. Keep the full offered set, including failed and skipped cases.
PRACTISE · TEST YOUR UNDERSTANDING
Quick check
Select an answer or type your own for each question. Press Submit practice to review the five responses. This is a formative beta exercise, not a graded assessment.
0 / 5 answered
Answer all 5 questions to submit.
What you can now do
Mark a defensible supply or demand area without assuming price will return or bounce.
Calculate a planned loss before discussing upside.
Explain how the chart idea could fail.
Next lesson
C04.2 · Liquidity Sweeps and Stop Runs.
Student clarity check
Could you explain the idea in your own words, reproduce the calculation and complete the exercise without seeing an instructor's answer? Does the diagram actually show the concept? Please record exact lesson codes and specific points of confusion for the independent Claude audit.