Risk-first learningIndependent practiceNo membership or sign-in required
Independent student audit copy. This revised Student Edition is still under instructor and learner review. The questions are formative only; formal grades and private answer keys are not available here.
FIRST OFFICER · DATA-BASED CHART LAB
Confluence versus duplicated information
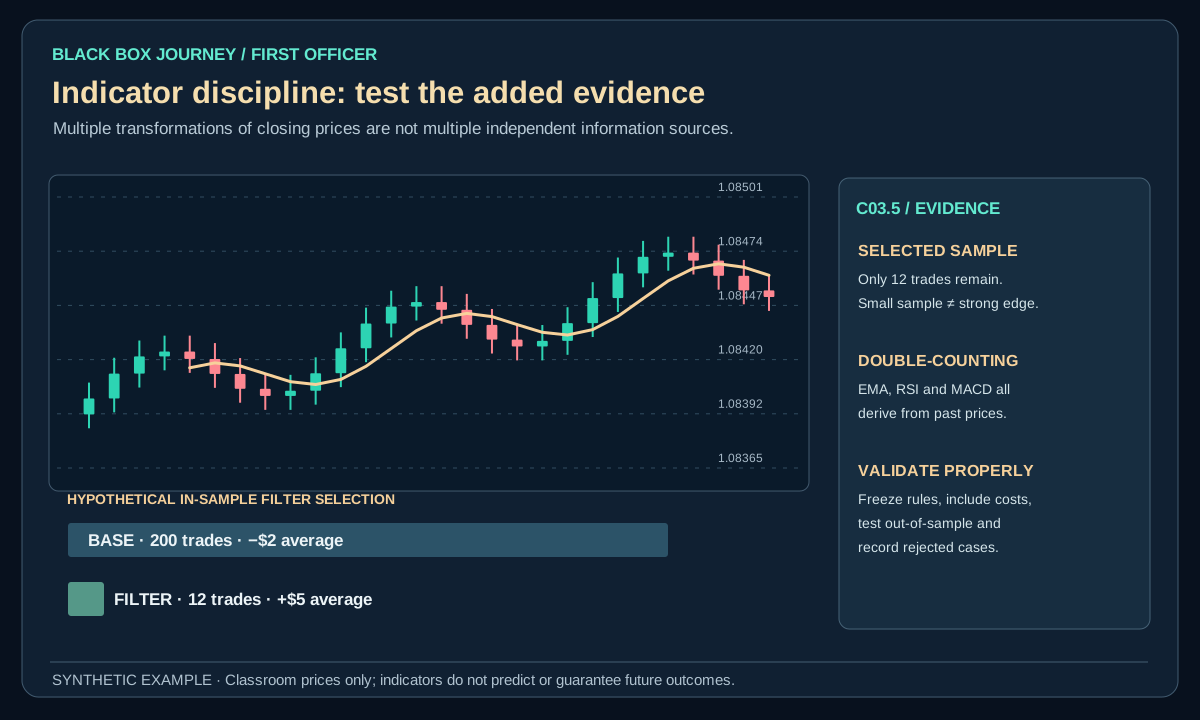
EMA, SMA and Bollinger middle all depend on the same closing prices. Three similar signals do not necessarily equal three independent confirmations.
EURUSD · M15 · 5 digits
What to learn
EMA, SMA and Bollinger middle all depend on the same closing prices. Three similar signals do not necessarily equal three independent confirmations.
What not to assume
A chart with many indicators can still be wrong. Check the underlying evidence and your pre-defined invalidation.
These plotted values derive from 90 completed synthetic EURUSD bars. They are not broker history, out-of-sample strategy results, recommendations or proof of profitability.
First Officer · C03: Indicators · About 25–30 minutes
Safety rule: Indicators describe calculated past observations. Work out risk before treating an indicator reading as evidence.
Your mission today
By the end you can judge whether adding an indicator improves a stated rule rather than merely making the chart look complex.
Before you start
Complete C02 and open a demo chart with a visible, fixed indicator setting. Use a calculator for the imaginary examples.
1. The idea in everyday words
Four friends repeating one rumour do not make four independent sources. Confluence means several conditions point to a related interpretation, but RSI, MACD and moving averages can recycle the same underlying prices. More matching colours do not automatically add information.
A useful filter should reduce a specific failure mode, not simply make the chart appear more technical. Confluence is valuable when different information sources change the probability or payoff distribution; four derivatives of the same closing prices may add virtually no information.
2. Worked example: what could be lost?
Imagine a simulated EURUSD demo method has 200 trades with average net result −$2 per trade. Adding a new filter keeps only 12 trades and produces +$5 average in the same historical sample. That result may be selection noise rather than a new edge.
For a separate arithmetic check, suppose each of those twelve hypothetical trades risks $10 on a loss but targets $3 on a win. Ten wins and two losses would yield 10 × $3 − 2 × $10 = +$10 before any unmodelled costs. The small sample and this one trade sequence establish neither future profitability nor a reliable EURUSD signal.
Open the diagram for full-size detail on a mobile screen. All illustrated prices are synthetic unless explicitly sourced as historical market data.
Original Black Box Journey schematic. Synthetic teaching example, not a historical strategy result.
BLACK BOX JOURNEY · LESSON VISUAL WORKSHOP
See the concept, the decision and the mistake
3 original teaching figures for lesson C03.5. Read each panel in order and compare the chart, calculation or decision with the explanation above. Tap Expand for a full-size review. Diagrams and prices are classroom illustrations, not live market records or validated trading signals.
Loading 3 teaching visuals…
3. How the calculation or observation works
Write one hypothesis before testing: for example, 'a volatility threshold may exclude low-movement breakout failures'. Specify the indicator, timeframe, threshold, price inputs and entry/skip rule. Compare results with and without the filter on identical chronological data and costs.
Technical detail: Write the hypothesis before testing an indicator: for example, a volatility filter might exclude dead ranges that previously stalled breakout trades. Compare trades with and without the filter on identical data and realistic costs. Reserve an untouched period for evaluation, and reject filters that leave too few independent observations.
4. Know the limitation
Keep an out-of-sample period untouched when choosing the filter. Test sensitivity: if changing RSI threshold from 59 to 60 destroys the apparent benefit, the rule may be fragile. Do not add twenty clauses after seeing twenty losing trades and report the fitted result as if it were expected in live markets.
Adding rules after every losing trade progressively shrinks frequency and overfits history. A high in-sample win rate without adequate sample and payoff distribution proves very little.
5. Practise independently
Create one strategy card with no more than two indicator conditions. Run a paper comparison on a clearly labelled fabricated dataset, counting all eligible and rejected cases. Write an acceptance rule before looking at the outcome.
This exercise demonstrates the concept, not a verified earnings edge. Save all qualifying examples and failures.
6. Keep indicators from counting the same evidence twice
Synthetic EURUSD example: An H1 chart is trending upward, and the M15 RSI is above 60. A second indicator, MACD, also rises because both react to many of the same recent closes. Treating this as two independent confirmations exaggerates the amount of new information. First write down exactly what each indicator measures, its lookback setting and the decision it changes.
Imagine your plan needs one trend description and one volatility measure. You could compare an EMA slope against ATR instead of adding four momentum indicators that all follow recent closes. This still does not validate a strategy. The useful question is whether the added rule improves a properly sampled decision process after costs, not whether the chart looks more convincing.
Suppose an imaginary long at Ask 1.08520 with a Bid stop at 1.08420 would lose 10 pips, or −$10 at $1 per pip before fees. A later Bid at 1.08670 would create +15 pips in one hypothetical path. Neither indicator removes the possibility of the planned loss.
Practice record: Run ten closed-bar replay cases with one indicator, then the same ten with a second. Keep entry and skip rules fixed. Record any changed decisions, duplicated information and the first timestamp each reading was available.
Common mistake
Treating an indicator label as an entry permission without knowing its calculation, decision timestamp, costs or failure condition. Fix it by stating what the indicator measures, what it cannot establish, and what your written risk rule requires.
Plain-English glossary
Confluence: Several qualifying observations considered together.
Overfitting: Choosing rules that mainly match past noise.
Out-of-sample: Data held back from rule design.
Expectancy: Average result per trade under stated outcome and cost assumptions.
Filter: A rule that accepts or rejects candidate entries.
Try it yourself
Create one strategy card with no more than two indicator conditions. Run a paper comparison on a clearly labelled fabricated dataset, counting all eligible and rejected cases. Write an acceptance rule before looking at the outcome. Save the parameters, chart timestamp and worked arithmetic in your journal.
PRACTISE · TEST YOUR UNDERSTANDING
Quick check
Select an answer or type your own for each question. Press Submit practice to review the five responses. This is a formative beta exercise, not a graded assessment.
0 / 5 answered
Answer all 5 questions to submit.
What you can now do
Judge whether adding an indicator improves a stated rule rather than merely making the chart look complex.
Explain one important indicator limitation without predicting returns.
Make a risk-aware and reproducible decision to proceed, wait or skip.
Next lesson
C04.1 · Supply and Demand Zones.
Student clarity check
Could you explain the idea in your own words, reproduce the calculation and complete the exercise without seeing an instructor's answer? Does the diagram actually show the concept? Please record exact lesson codes and specific points of confusion for the independent Claude audit.