Risk-first learningIndependent practiceNo membership or sign-in required
Independent student audit copy. This revised Student Edition is still under instructor and learner review. The questions are formative only; formal grades and private answer keys are not available here.
FIRST OFFICER · DATA-BASED CHART LAB
Tick activity and indicative weighted price
This illustration weights each completed bar's typical price by synthetic tick count. It is NOT exchange-wide traded-volume VWAP.
EURUSD · M15 · 5 digits
What to learn
This illustration weights each completed bar's typical price by synthetic tick count. It is NOT exchange-wide traded-volume VWAP.
What not to assume
Spot FX has no single centralised volume feed. Broker tick counts vary, so do not treat this line as institutional VWAP or true market volume.
These plotted values derive from 90 completed synthetic EURUSD bars. They are not broker history, out-of-sample strategy results, recommendations or proof of profitability.
First Officer · C03: Indicators · About 25–30 minutes
Safety rule: Indicators describe calculated past observations. Work out risk before treating an indicator reading as evidence.
Your mission today
By the end you can calculate a volume-weighted average and recognise when a chart does not contain complete market volume.
Before you start
Complete C02 and open a demo chart with a visible, fixed indicator setting. Use a calculator for the imaginary examples.
1. The idea in everyday words
Picture a fruit stall: a price paid on one apple sale should count less than a price paid for thirty apples. VWAP, volume-weighted average price, also weights each price by its volume. But a VWAP line is only as representative as the volume source and the chosen time window.
Volume must be interpreted according to the market and data source. Exchange volume counts transactions on a venue; OTC forex often provides broker tick counts rather than a unified traded-volume record. VWAP weights observed trade prices by trade volume and is meaningful only relative to its specific feed and anchoring window.
2. Worked example: what could be lost?
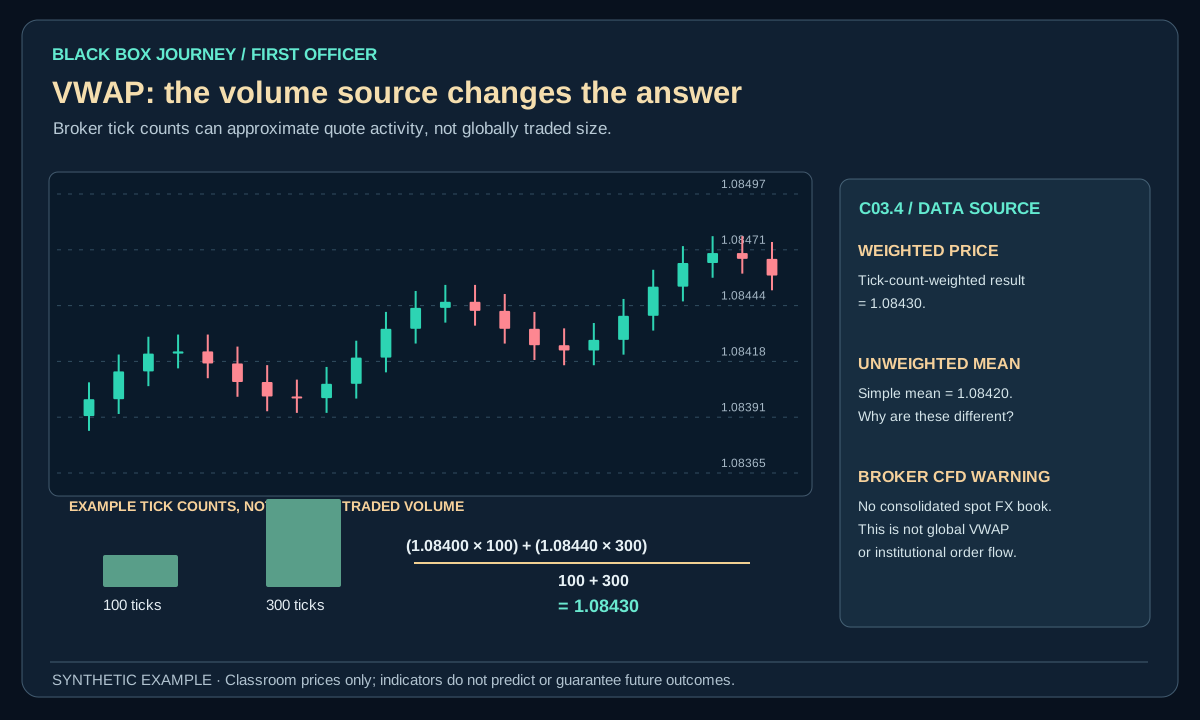
Take two invented EURUSD typical-price observations: 1.08400 with a synthetic count of 100 broker ticks, and 1.08440 with 300 ticks. Their tick-count-weighted indicative average is (1.08400 × 100 + 1.08440 × 300) ÷ 400 = 1.08430. Their simple unweighted average would be 1.08420.
This is not true consolidated traded-volume VWAP. In decentralised spot FX, broker tick counts are only a limited activity proxy. To make a separate cash-risk example, a fictional EURUSD long filled at Ask 1.08430 with stop at Bid 1.08330 has 10 pips of planned downside. At 0.20 standard lot ($2 per pip), that is −$20 before additional costs. A later Bid at 1.08530 would be +10 pips or +$20 instead. The weighted-price calculation selects neither outcome.
Open the diagram for full-size detail on a mobile screen. All illustrated prices are synthetic unless explicitly sourced as historical market data.
Original Black Box Journey schematic. Synthetic teaching example, not a historical strategy result.
BLACK BOX JOURNEY · LESSON VISUAL WORKSHOP
See the concept, the decision and the mistake
3 original teaching figures for lesson C03.4. Read each panel in order and compare the chart, calculation or decision with the explanation above. Tap Expand for a full-size review. Diagrams and prices are classroom illustrations, not live market records or validated trading signals.
Loading 3 teaching visuals…
3. How the calculation or observation works
For a session VWAP, accumulate price×volume and volume from the agreed session start. Anchor means the starting point of that calculation. A weekly anchored line and a daily reset line use different windows, so they can disagree without either being a mathematical error.
Technical detail: Session VWAP is typically the sum of price-times-volume divided by total volume since session start. It can help describe the average transacted price for that session, but using broker tick volume as though it were complete global FX volume is a category error. A daily reset and a monthly anchor answer different questions.
4. Know the limitation
Exchange volume may describe transactions on a specific venue. Retail spot forex and many CFDs show broker tick counts or provider-derived measures, not every global trade. Never call those feeds 'complete institutional order flow'. Synthetic diagrams must say they are synthetic.
Assuming an indicator labelled VWAP uses exchange-grade volume everywhere misleads students. A VWAP line from synthetic or tick-based data should be labelled accurately and never called institutional order flow.
5. Practise independently
Compute VWAP for four fabricated price/volume pairs. Repeat with every volume set equal and describe the difference. Then locate the volume description in your demo platform's documentation.
This exercise demonstrates the concept, not a verified earnings edge. Save all qualifying examples and failures.
6. Ask whose volume the indicator represents
Synthetic calculation: Imagine an exchange reports 20 units traded at price 1.08400 and another 10 units at 1.08600. A simple volume-weighted average price (VWAP) for just those executions is (20 × 1.08400 + 10 × 1.08600) / 30 = 1.08467, rounded to five decimals. The denominator is 30 recorded units. Change the venue, session reset or underlying trade records and you may get a different VWAP.
A retail spot-forex chart often shows tick volume, which counts quote updates observed by that data provider rather than all worldwide executed EURUSD volume. An index future's exchange volume and a broker CFD's tick count should not be treated as the same input. Some platforms label both simply 'Volume', which is an invitation to check the specification, not to guess.
Imagine a Buy at Ask 1.08500 with a Bid stop at 1.08400. The 10-pip planned loss is −$10 at an invented $1 per pip before costs, regardless of where a particular VWAP line sits.
Practice record: Find the volume source and session reset on two demo products. Record whether it is traded contracts, trades or quote ticks. Recompute one small VWAP example from its stated input data.
Common mistake
Treating an indicator label as an entry permission without knowing its calculation, decision timestamp, costs or failure condition. Fix it by stating what the indicator measures, what it cannot establish, and what your written risk rule requires.
Plain-English glossary
VWAP: Sum of price times volume divided by total volume.
Volume: Amount recorded by the chosen source.
Tick volume: Count of quote or price updates in some feeds.
Anchor: Start time of a cumulative calculation.
Session: Defined market-time interval.
Try it yourself
Compute VWAP for four fabricated price/volume pairs. Repeat with every volume set equal and describe the difference. Then locate the volume description in your demo platform's documentation. Save the parameters, chart timestamp and worked arithmetic in your journal.
PRACTISE · TEST YOUR UNDERSTANDING
Quick check
Select an answer or type your own for each question. Press Submit practice to review the five responses. This is a formative beta exercise, not a graded assessment.
0 / 5 answered
Answer all 5 questions to submit.
What you can now do
Calculate a volume-weighted average and recognise when a chart does not contain complete market volume.
Explain one important indicator limitation without predicting returns.
Make a risk-aware and reproducible decision to proceed, wait or skip.
Next lesson
C03.5 · Evidence, Confluence and Indicator Discipline.
Student clarity check
Could you explain the idea in your own words, reproduce the calculation and complete the exercise without seeing an instructor's answer? Does the diagram actually show the concept? Please record exact lesson codes and specific points of confusion for the independent Claude audit.