Risk-first learningIndependent practiceNo membership or sign-in required
Independent student audit copy. This revised Student Edition is still under instructor and learner review. The questions are formative only; formal grades and private answer keys are not available here.
FIRST OFFICER · DATA-BASED CHART LAB
Bollinger Bands and ATR
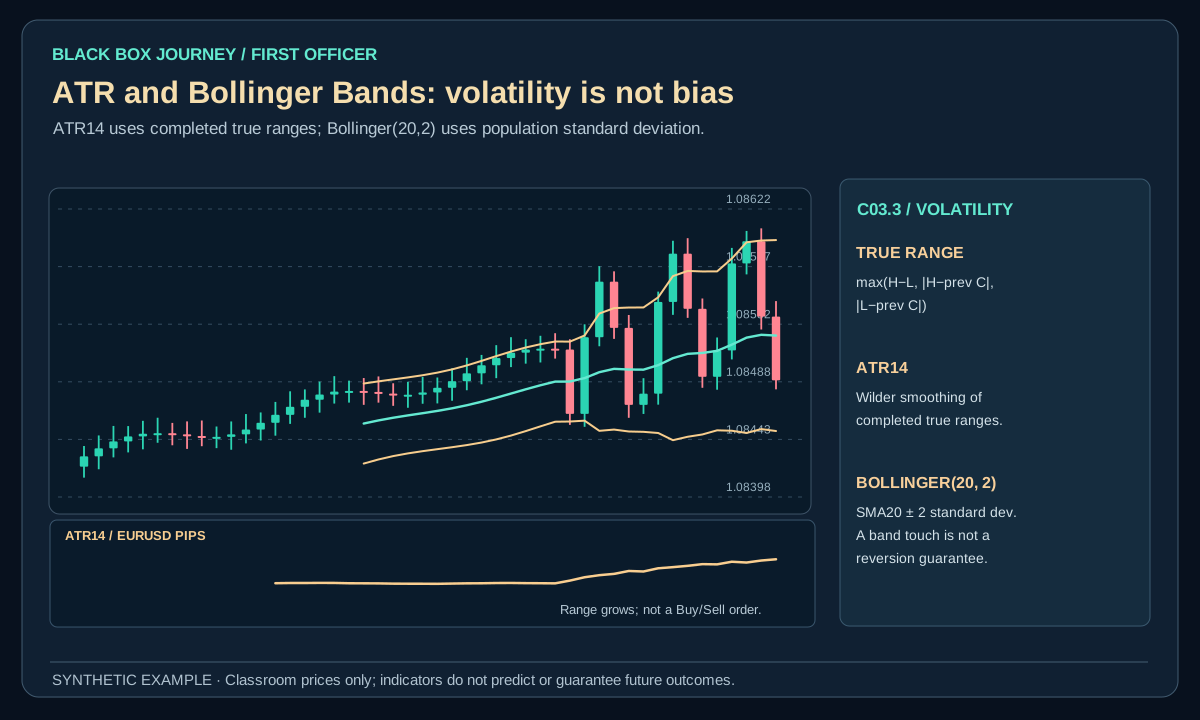
Bollinger Bands use a 20-close mean plus or minus two population-standard deviations. ATR14 measures recent true range with Wilder smoothing.
EURUSD · M15 · 5 digits
What to learn
Bollinger Bands use a 20-close mean plus or minus two population-standard deviations. ATR14 measures recent true range with Wilder smoothing.
What not to assume
ATR is a range statistic, not a predicted next-bar move; band contact alone is not an entry rule.
These plotted values derive from 90 completed synthetic EURUSD bars. They are not broker history, out-of-sample strategy results, recommendations or proof of profitability.
First Officer · C03: Indicators · About 25–30 minutes
Safety rule: Indicators describe calculated past observations. Work out risk before treating an indicator reading as evidence.
Your mission today
By the end you can calculate a simple true range and explain why volatility changes stop size and cash risk.
Before you start
Complete C02 and open a demo chart with a visible, fixed indicator setting. Use a calculator for the imaginary examples.
1. The idea in everyday words
A quiet road and a busy highway need different stopping distances. Volatility describes the scale of price movement, not its direction. ATR, Average True Range, summarises recent price ranges. Bollinger Bands place bands around a moving average using a measure of dispersion, commonly standard deviation.
Volatility tools measure scale, not direction. Average True Range estimates typical recent bar movement including gaps; Bollinger Bands place a volatility-based envelope around a moving average. Knowing whether a $3 price movement is unusually large helps calibrate stops and expectations.
2. Worked example: what could be lost?
For a separate gold-specific illustration, imagine XAUUSD ATR rising from $2 to $8 per troy ounce. A trader chooses a fixed $3 per-ounce stop distance with a fictional 10-troy-ounce exposure. If that stop were filled exactly, the planned price loss would be $3 × 10 oz = $30 before costs. Widening the stop to $8 per ounce without changing size raises that planned loss to $8 × 10 oz = $80, before slippage. An $8 favourable gold move would also change this position's nominal value by $80, but a higher ATR cannot choose direction.
The interactive EURUSD chart in this lesson uses pips, not gold dollars per ounce. Never transfer XAUUSD contract multipliers or ATR units directly into a forex position-size calculation.
Open the diagram for full-size detail on a mobile screen. All illustrated prices are synthetic unless explicitly sourced as historical market data.
Original Black Box Journey schematic. Synthetic teaching example, not a historical strategy result.
BLACK BOX JOURNEY · LESSON VISUAL WORKSHOP
See the concept, the decision and the mistake
3 original teaching figures for lesson C03.3. Read each panel in order and compare the chart, calculation or decision with the explanation above. Tap Expand for a full-size review. Diagrams and prices are classroom illustrations, not live market records or validated trading signals.
Loading 3 teaching visuals…
3. How the calculation or observation works
True range is the greatest of: high−low, absolute(high−previous close), and absolute(low−previous close). Example: high 105, low 99, previous close 101 gives 6, 4 and 2, so true range is 6. ATR smooths such values over a declared window. Use the value known at decision time.
Technical detail: True range is the maximum of high minus low, absolute high minus previous close, and absolute low minus previous close. ATR smooths true range; Bollinger Bands commonly use a moving average plus and minus a multiple of standard deviation. Parameter choices should be stable and appropriate to the instrument.
4. Know the limitation
A Bollinger Band touch is not a law requiring price to return to the centre. In strong trends price can track the outer band. Do not change both the stop and lot size without recomputing cash loss. More volatility can also increase execution uncertainty.
Assuming a band touch must revert to the middle ignores the fact that strong trends can persist along a band. Using today's completed ATR on an earlier backtest decision creates lookahead.
5. Practise independently
Compute five true ranges and a simple average for a classroom sample. Compare planned losses when stop distance changes from $3 to $8 at constant versus risk-adjusted volume.
This exercise demonstrates the concept, not a verified earnings edge. Save all qualifying examples and failures.
6. Calculate range before making a volatility claim
Synthetic EURUSD candle: Today's hypothetical completed high is 1.08700, low is 1.08450 and the previous close is 1.08900. Its candle range is 25 pips. But true range is the largest of high minus low (25 pips), absolute high minus previous close (20 pips), and absolute low minus previous close (45 pips). The true range here is 45 pips because the gap from the previous close matters. ATR averages smoothed true ranges; it is not a prediction that the next candle must move 45 pips.
Bollinger Bands show an average with a width derived from recent dispersion. A wider band means the historical calculation reflects greater variation under that setting, not that the market will reverse. A narrow band may remain narrow or widen in either direction.
For an imagined long at Ask 1.08600 with a planned Bid stop at 1.08450, price risk is 15 pips, or −$15 at $1 per pip before costs. ATR does not substitute for the stop or a cash-risk limit.
Practice record: Calculate the three true-range candidates for five completed candles. Compare the platform's ATR period and band settings, then record two cases where a visually 'quiet' candle appears near a wider multi-bar volatility measure.
Common mistake
Treating an indicator label as an entry permission without knowing its calculation, decision timestamp, costs or failure condition. Fix it by stating what the indicator measures, what it cannot establish, and what your written risk rule requires.
Plain-English glossary
Volatility: Typical size of price movements.
True range: Largest of three range measures including a gap.
ATR: Smoothed average of true range.
Standard deviation: A measure of how spread out values are.
Bollinger Bands: Bands around an average based on dispersion.
Try it yourself
Compute five true ranges and a simple average for a classroom sample. Compare planned losses when stop distance changes from $3 to $8 at constant versus risk-adjusted volume. Save the parameters, chart timestamp and worked arithmetic in your journal.
PRACTISE · TEST YOUR UNDERSTANDING
Quick check
Select an answer or type your own for each question. Press Submit practice to review the five responses. This is a formative beta exercise, not a graded assessment.
0 / 5 answered
Answer all 5 questions to submit.
What you can now do
Calculate a simple true range and explain why volatility changes stop size and cash risk.
Explain one important indicator limitation without predicting returns.
Make a risk-aware and reproducible decision to proceed, wait or skip.
Next lesson
C03.4 · VWAP, Volume and Data Limitations.
Student clarity check
Could you explain the idea in your own words, reproduce the calculation and complete the exercise without seeing an instructor's answer? Does the diagram actually show the concept? Please record exact lesson codes and specific points of confusion for the independent Claude audit.