Risk-first learningIndependent practiceNo membership or sign-in required
Independent student audit copy. This revised Student Edition is still under instructor and learner review. The questions are formative only; formal grades and private answer keys are not available here.
FIRST OFFICER · DATA-BASED CHART LAB
RSI14 and MACD(12,26,9)
RSI scales recent upward and downward changes to 0–100. MACD subtracts two EMAs; its signal is an EMA of that difference.
EURUSD · M15 · 5 digits
What to learn
RSI scales recent upward and downward changes to 0–100. MACD subtracts two EMAs; its signal is an EMA of that difference.
What not to assume
RSI at 70 does not prove an immediate reversal. A MACD cross is not automatically an executable profitable signal.
These plotted values derive from 90 completed synthetic EURUSD bars. They are not broker history, out-of-sample strategy results, recommendations or proof of profitability.
First Officer · C03: Indicators · About 25–30 minutes
Safety rule: Indicators describe calculated past observations. Work out risk before treating an indicator reading as evidence.
Your mission today
By the end you can explain RSI and MACD as summaries of recent momentum rather than automatic buy or sell signals.
Before you start
Complete C02 and open a demo chart with a visible, fixed indicator setting. Use a calculator for the imaginary examples.
1. The idea in everyday words
Imagine a cyclist speeding up and slowing down on a hill. Momentum describes how movement changes. The RSI, or Relative Strength Index, compares recent upward and downward closing changes on a bounded scale. MACD, Moving Average Convergence Divergence, compares exponential moving averages and a signal line. Neither sees tomorrow.
Momentum indicators transform past prices rather than adding new information. RSI compares the magnitude of recent upward and downward closes; MACD measures the difference between exponential averages. Their readings can describe acceleration, exhaustion or persistent trends, but overbought is not synonymous with an immediate short signal.
2. Worked example: what could be lost?
Imagine EURUSD rising from 1.08000 to 1.10000 while RSI remains above 70. A trader shorting every so-called 'overbought' reading may lose repeatedly. Suppose one imaginary short opens at Bid 1.09120 and is stopped at Ask 1.09520. The loss is 40 pips. At 0.03 standard EURUSD lot ($0.30 per pip in a USD-denominated account), the planned price loss is −$12 before costs or worse fills.
A later fall to an executable Ask of 1.08720 would have produced +40 pips or +$12 in this separate hypothetical outcome. The RSI reading alone cannot distinguish these paths.
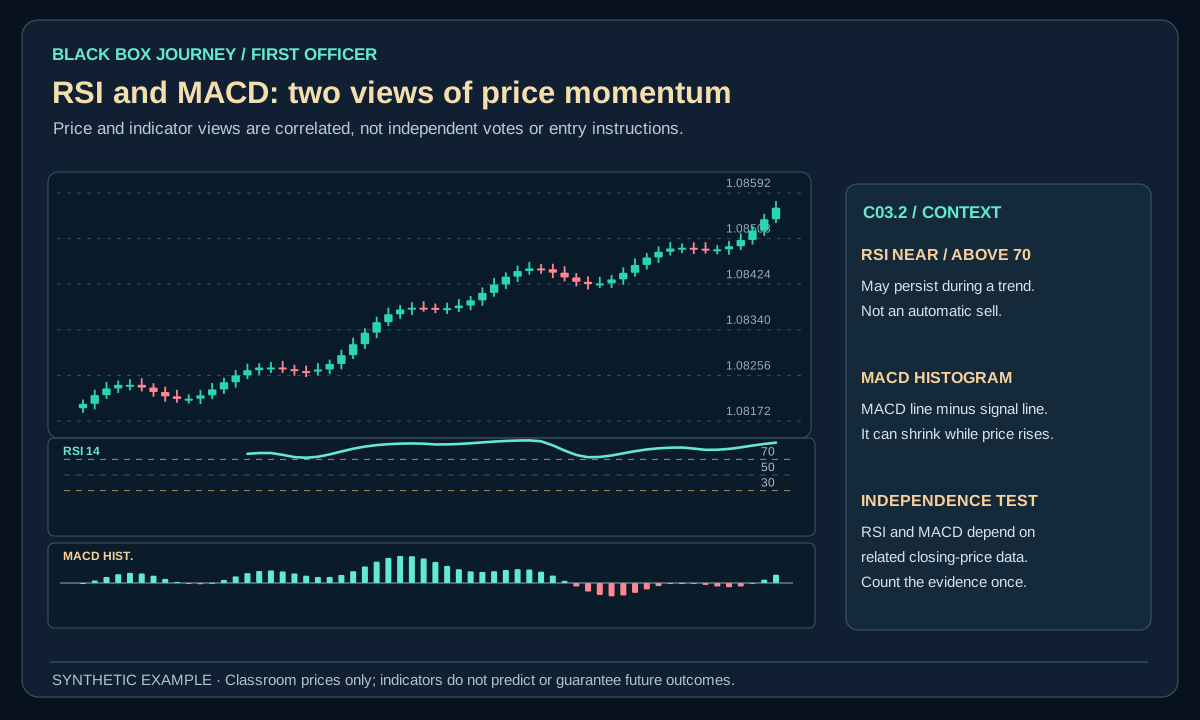
Open the diagram for full-size detail on a mobile screen. All illustrated prices are synthetic unless explicitly sourced as historical market data.
Original Black Box Journey schematic. Synthetic teaching example, not a historical strategy result.
BLACK BOX JOURNEY · LESSON VISUAL WORKSHOP
See the concept, the decision and the mistake
3 original teaching figures for lesson C03.2. Read each panel in order and compare the chart, calculation or decision with the explanation above. Tap Expand for a full-size review. Diagrams and prices are classroom illustrations, not live market records or validated trading signals.
Loading 3 teaching visuals…
3. How the calculation or observation works
Read the RSI value relative to recent structure and your declared timeframe. A high RSI can persist during a strong trend. MACD crossing its signal line is a defined historical comparison, not future confirmation. A divergence is when price and an indicator make different relative extremes; it can persist without reversal.
Technical detail: RSI typically uses smoothed gains and losses over a defined period. MACD line, signal line and histogram capture related forms of momentum. Compare indicator conditions with price structure: RSI remaining elevated during a strong trend is normal, while divergence can persist long before any reversal occurs.
4. Know the limitation
Combining RSI, MACD and two moving averages can give an illusion of four independent votes. They all largely transform the same price series. Test one clear hypothesis rather than selecting whichever indicator agrees with a desired entry.
Indicator stacking often double-counts information because RSI, MACD and moving averages derive from the same closing-price series. Agreement among correlated tools is not independent confirmation.
5. Practise independently
Mark five RSI extremes and five MACD histogram turns on closed bars. Record how many preceded, followed or never matched an actual price pivot under your stated pivot rule.
This exercise demonstrates the concept, not a verified earnings edge. Save all qualifying examples and failures.
6. Check what RSI and MACD agree about
Synthetic EURUSD observation: Price has closed higher in eight of the last ten M15 candles. RSI reads 72, while the MACD histogram is positive but smaller than on the previous completed bar. The high RSI describes comparatively strong recent upward changes; the shrinking histogram describes a smaller difference between the MACD line and its signal line. These observations are not contradictory, and neither is a command to sell.
Suppose an imaginary short begins at Bid 1.08500 and plans to stop at Ask 1.08620. That is 12 pips of planned price risk, or −$12 at a fictional $1 per pip before costs. A later Ask at 1.08380 would yield +12 pips in a different possible outcome. The chosen RSI threshold provides no measured probability of either move. The indicators transform similar past prices, so agreement is not independent confirmation.
Practice record: For ten completed bars, capture closing price, RSI, MACD line, signal line, histogram and the H1 structure label. Note when RSI is high while MACD momentum slows, and whether the price subsequently continues, ranges or turns. Record all cases, not just the photogenic reversals.
Common mistake
Treating an indicator label as an entry permission without knowing its calculation, decision timestamp, costs or failure condition. Fix it by stating what the indicator measures, what it cannot establish, and what your written risk rule requires.
Plain-English glossary
Momentum: A description of recent price-change behaviour.
RSI: Indicator summarising recent up and down closes.
MACD: Difference between exponential averages with a signal comparison.
Divergence: A mismatch between relative price and indicator extremes.
Try it yourself
Mark five RSI extremes and five MACD histogram turns on closed bars. Record how many preceded, followed or never matched an actual price pivot under your stated pivot rule. Save the parameters, chart timestamp and worked arithmetic in your journal.
PRACTISE · TEST YOUR UNDERSTANDING
Quick check
Select an answer or type your own for each question. Press Submit practice to review the five responses. This is a formative beta exercise, not a graded assessment.
0 / 5 answered
Answer all 5 questions to submit.
What you can now do
Explain RSI and MACD as summaries of recent momentum rather than automatic buy or sell signals.
Explain one important indicator limitation without predicting returns.
Make a risk-aware and reproducible decision to proceed, wait or skip.
Next lesson
C03.3 · ATR, Bollinger Bands and Volatility.
Student clarity check
Could you explain the idea in your own words, reproduce the calculation and complete the exercise without seeing an instructor's answer? Does the diagram actually show the concept? Please record exact lesson codes and specific points of confusion for the independent Claude audit.