Risk-first learningIndependent practiceNo membership or sign-in required
Independent student audit copy. This revised Student Edition is still under instructor and learner review. The questions are formative only; formal grades and private answer keys are not available here.
FIRST OFFICER · DATA-BASED CHART LAB
SMA20 versus EMA20
These are two calculations from the same completed EURUSD closes. EMA reacts more quickly to recent prices; neither line predicts the next candle.
EURUSD · M15 · 5 digits
What to learn
These are two calculations from the same completed EURUSD closes. EMA reacts more quickly to recent prices; neither line predicts the next candle.
What not to assume
A crossover is an observed relationship. Testing and costs are needed before anyone calls it an edge.
These plotted values derive from 90 completed synthetic EURUSD bars. They are not broker history, out-of-sample strategy results, recommendations or proof of profitability.
First Officer · C03: Indicators · About 25–30 minutes
Safety rule: Indicators describe calculated past observations. Work out risk before treating an indicator reading as evidence.
Your mission today
By the end you can calculate an SMA and explain why EMA signals lag and may fail in a range.
Before you start
Complete C02 and open a demo chart with a visible, fixed indicator setting. Use a calculator for the imaginary examples.
1. The idea in everyday words
A moving average is a moving summary of recent prices. It is like an average test score: useful for describing what has happened, but unable to tell you the score on your next test. An SMA gives equal weight to its window; an EMA gives recent closes more weight.
A moving average smooths earlier prices to make direction easier to see. A simple moving average weights each observation equally, while an exponential moving average gives recent observations greater weight. Neither knows the future: a smooth line always trades responsiveness against noise.
2. Worked example: what could be lost?
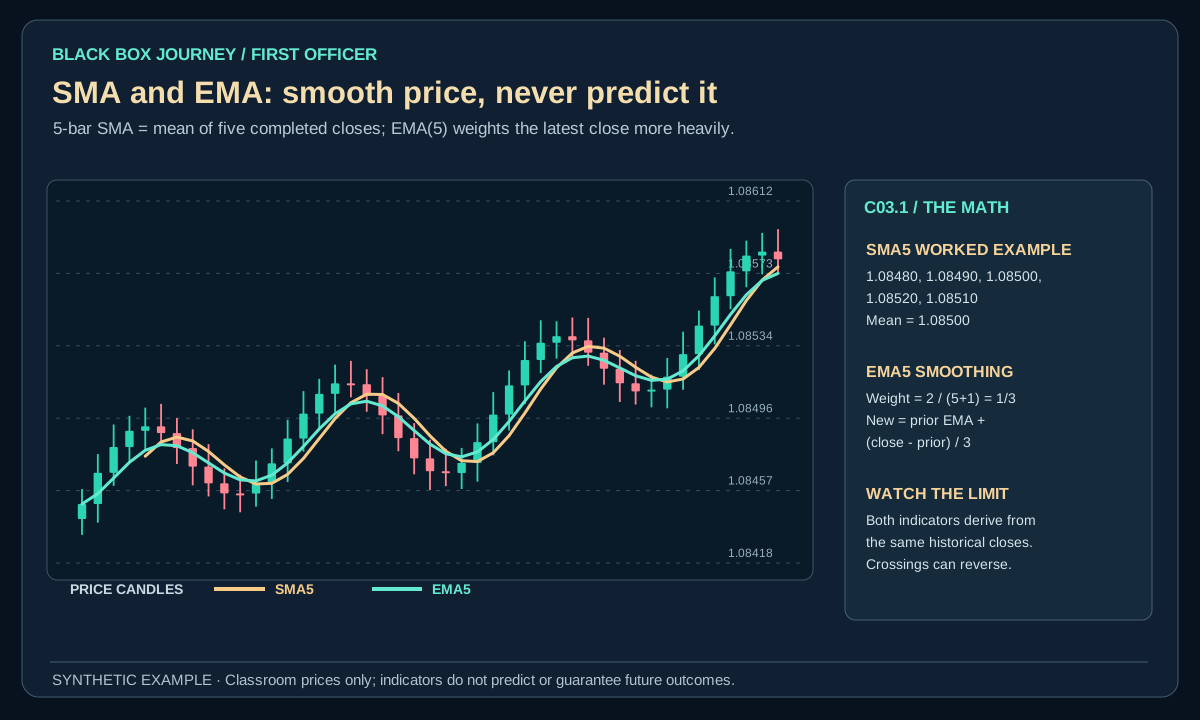
Use five completed EURUSD M15 closing quotes: 1.08480, 1.08490, 1.08500, 1.08520 and 1.08510. The SMA5 is (1.08480 + 1.08490 + 1.08500 + 1.08520 + 1.08510) ÷ 5 = 1.08500. A student who shorts solely because price slips below that average could still lose if the range reverses.
Suppose the imaginary short opens at Bid 1.08490 with a protective stop at Ask 1.08520. The planned distance is 3 pips. At a hypothetical 0.20 standard EURUSD lot ($2 per pip for a USD-denominated account), the price risk is −$6 before costs or adverse fill effects. If a later executable Ask fell to 1.08460, that would instead be +3 pips or +$6 before separate costs. Neither result follows from the average itself.
Open the diagram for full-size detail on a mobile screen. All illustrated prices are synthetic unless explicitly sourced as historical market data.
Original Black Box Journey schematic. Synthetic teaching example, not a historical strategy result.
BLACK BOX JOURNEY · LESSON VISUAL WORKSHOP
See the concept, the decision and the mistake
3 original teaching figures for lesson C03.1. Read each panel in order and compare the chart, calculation or decision with the explanation above. Tap Expand for a full-size review. Diagrams and prices are classroom illustrations, not live market records or validated trading signals.
Loading 3 teaching visuals…
3. How the calculation or observation works
For EMA length N, the common smoothing weight is 2÷(N+1). For N=5, the weight is 1/3. With a prior EURUSD EMA of 1.08500 and a new completed close of 1.08530, the updated EMA is 1.08500 + (1.08530 − 1.08500) × 1/3 = 1.08510. That is a description of past prices, not proof that 101 is support. Use only completed bars when testing a crossover rule.
Technical detail: Calculate a five-bar SMA by summing the five closing prices and dividing by five. An EMA uses a smoothing factor of 2 divided by N plus 1 and recursively combines the newest close with the previous EMA. Both can help define a testable trend filter, but repeated crossings in sideways markets are expected.
4. Know the limitation
Faster averages may react sooner but produce more crossings in sideways conditions. Two averages based on the same closes are correlated indicators, not independent confirmation. Changing lengths until all past losses vanish is curve-fitting.
Treating an EMA as support because price once bounced there creates circular confirmation. Optimising dozens of average lengths until one fits history often collapses in new data.
5. Practise independently
On twenty closed-bar examples calculate SMA5, then compare an EMA5 using a provided starting value. Mark crossovers that reverse immediately and label decisions made before versus after a close.
This exercise demonstrates the concept, not a verified earnings edge. Save all qualifying examples and failures.
6. Recalculate one average before trusting its line
Synthetic EURUSD closes: Assume the last three completed closes are 1.08400, 1.08500 and 1.08600. A three-period simple moving average (SMA) equals (1.08400 + 1.08500 + 1.08600) / 3 = 1.08500. A three-period exponential moving average (EMA) gives more weight to the newest close. With smoothing factor 2 / (3 + 1) = 0.5, and a previous EMA of 1.08400, the new EMA is 0.5 × 1.08600 + 0.5 × 1.08400 = 1.08500. These invented numbers happen to match today; other sequences need not.
A moving average cannot move until its source observations change. A crossover becomes known only after the bar that defines it closes under a closed-bar method. For an imaginary long at Ask 1.08620 with a Bid stop at 1.08520, planned price risk is 10 pips, or −$10 at $1 per pip before costs. A crossing line cannot reduce that risk.
Practice record: Calculate SMA and EMA manually for five completed closes. Record the smoothing rule, previous EMA, current value and chart timestamp. Compare your figures with a demo platform using the same settings. Investigate any mismatch before treating the indicator as evidence.
Common mistake
Treating an indicator label as an entry permission without knowing its calculation, decision timestamp, costs or failure condition. Fix it by stating what the indicator measures, what it cannot establish, and what your written risk rule requires.
Plain-English glossary
SMA: Simple moving average of equally weighted closes.
EMA: Exponential moving average weighted towards recent closes.
Lag: Delay because an indicator summarises earlier observations.
Crossover: One indicator moving past another under a defined rule.
Try it yourself
On twenty closed-bar examples calculate SMA5, then compare an EMA5 using a provided starting value. Mark crossovers that reverse immediately and label decisions made before versus after a close. Save the parameters, chart timestamp and worked arithmetic in your journal.
PRACTISE · TEST YOUR UNDERSTANDING
Quick check
Select an answer or type your own for each question. Press Submit practice to review the five responses. This is a formative beta exercise, not a graded assessment.
0 / 5 answered
Answer all 5 questions to submit.
What you can now do
Calculate an SMA and explain why EMA signals lag and may fail in a range.
Explain one important indicator limitation without predicting returns.
Make a risk-aware and reproducible decision to proceed, wait or skip.
Next lesson
C03.2 · RSI, MACD and Momentum Context.
Student clarity check
Could you explain the idea in your own words, reproduce the calculation and complete the exercise without seeing an instructor's answer? Does the diagram actually show the concept? Please record exact lesson codes and specific points of confusion for the independent Claude audit.