Risk-first learningIndependent practiceNo membership or sign-in required
Independent student audit copy. This revised Student Edition is still under instructor and learner review. The questions are formative only; formal grades and private answer keys are not available here.
First Officer · C02: Price Action · About 25–30 minutes
Safety rule: A candle formation cannot guarantee a market move. Define the cash loss before interpreting upside.
Your mission today
By the end you can compare trade ideas by executable entry, structural stop distance and space to the next obstacle.
Before you start
Use the completed C01 market-structure lessons, a demo price chart and a calculator. Mark reference levels before replay. Every number is imaginary.
1. Understand the pattern
A good route can still be a bad journey if you start at the wrong place. Trade location describes how far your entry sits from the level where the idea fails and from the nearest sensible objective. You can have an interesting market view but a poor entry price.
A trade idea becomes usable only when entry, invalidation and objective can be expressed numerically. Good entries are located where the thesis can be disproved without risking excessive cash. A beautiful setup that requires a stop beyond the account's risk budget is a legitimate no-trade decision.
2. Worked example: what could be lost?
An imaginary long enters at 102 with a stop at 99 and target at 108. Planned risk is 3 points and potential gross price movement 6 points, giving a stated reward-to-risk ratio of 2:1 before costs. At $5 per point, downside is −$15 and theoretical upside +$30. If you chase entry to 105, risk becomes 6 points or −$30, while potential upside shrinks to +$15. Same chart, worse entry economics.
Open the diagram for full-size detail on a mobile screen. All illustrated prices are synthetic unless explicitly sourced as historical market data.
Original Black Box Journey teaching schematic. Imaginary prices and outcomes only.
BLACK BOX JOURNEY · LESSON VISUAL WORKSHOP
See the concept, the decision and the mistake
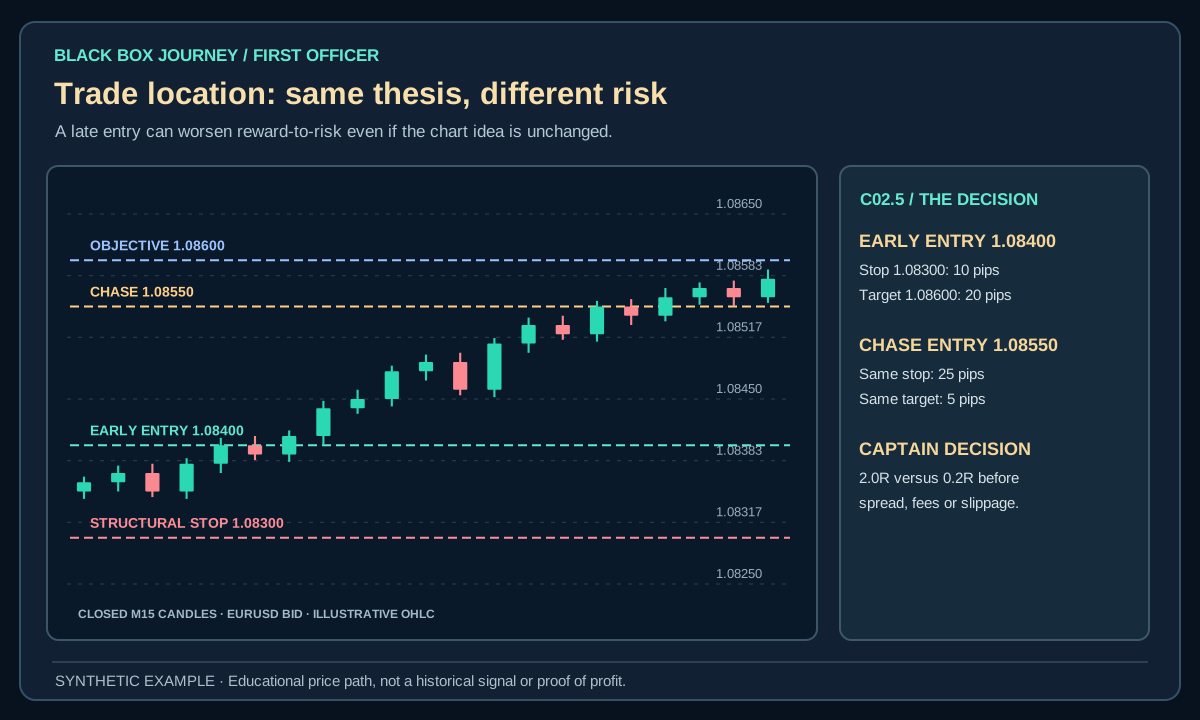
3 original teaching figures for lesson C02.5. Read each panel in order and compare the chart, calculation or decision with the explanation above. Tap Expand for a full-size review. Diagrams and prices are classroom illustrations, not live market records or validated trading signals.
Loading 3 teaching visuals…
3. Read the full context
Choose the structural price at which your idea is wrong before setting the volume. Calculate distance from actual expected Ask/Bid entry to that level. Mark the first obstacle and evaluate whether costs leave enough room. A target cannot be selected solely from a desired daily income.
Technical detail: For each candidate, identify the structural point that makes the idea wrong, the distance to the first obstacle, likely execution cost and position size. Evaluate at the actual anticipated fill, not at a hypothetical best price from a past chart. Document plans for no-fill, missed entry and adverse slippage.
4. Watch for the failure case
A visually attractive candle may be too far from the stop. A trade that cannot fit the risk cap at the broker's smallest lot is a skip. Always include a no-fill or missed-entry rule so you do not chase a late quote.
Setting targets by the day's desired income rather than market structure produces arbitrary exits. Repeatedly moving invalidation after losing trades erases the original risk estimate.
5. Practise a reproducible decision
On fifteen synthetic candidates, write entry, invalidation, obstacle, gross reward/risk and a trade-or-skip decision. Compare an early and late entry to show how location changes the numbers.
For comparison, the original source's example illustrates: One long candidate enters at 102 with a stop at 99 and target 108; gross reward-to-risk is 6 divided by 3, or 2R. A late entry at 105 with the same stop and target offers 3 divided by 6, or 0.5R. The market thesis may be unchanged, but the economics of the trade have deteriorated.
6. Write the entry, stop and no-trade condition on one ticket
Synthetic EURUSD ticket: Your plan requires a completed M15 close above 1.08600 and a later executable Ask below 1.08630. The most recent structural failure point is Bid 1.08520. If the actual hypothetical Ask is 1.08625, entry-to-stop distance is 10.5 pips. At $1 per pip, an assumed stop fill would create −$10.50 in price loss before extra costs. Your written cash-risk limit, broker volume step and expected transaction costs must all be checked before considering an order.
If the next available Ask is 1.08655, the planned entry ceiling has failed. Record SKIP, even if the next candle rises sharply. Moving the permitted entry higher after seeing the market move would create a different strategy. Equally, moving the stop from 1.08520 to 1.08570 just to afford a larger volume changes the original structural idea.
A hypothetical later executable Bid of 1.08800 from the accepted 1.08625 entry would create +17.5 pips, but this is an alternative scenario, not a signal.
Practice record: Fill in market, timeframe, observed trigger, executable side, structural stop, cash loss, allowed volume, spread cap, missed-entry rule and action. A reviewer should be able to approve or reject the ticket without seeing future candles.
Common mistake
A pattern name alone cannot approve an order. Always require a premarked reference, an exact confirmation rule, a structural failure level and a feasible cash-risk calculation.
Plain-English glossary
Entry: Executable price at which a position is opened.
Invalidation: A market observation that defeats the trade hypothesis.
Obstacle: Nearby price area that could interrupt the move.
Reward-to-risk: Proposed gross upside divided by planned downside.
Try it yourself
On fifteen synthetic candidates, write entry, invalidation, obstacle, gross reward/risk and a trade-or-skip decision. Compare an early and late entry to show how location changes the numbers. Save every eligible and skipped candidate at the decision timestamp.
PRACTISE · TEST YOUR UNDERSTANDING
Quick check
Select an answer or type your own for each question. Press Submit practice to review the five responses. This is a formative beta exercise, not a graded assessment.
0 / 5 answered
Answer all 5 questions to submit.
What you can now do
Compare trade ideas by executable entry, structural stop distance and space to the next obstacle.
State a concrete observation that would disqualify the idea.
Calculate the loss from the proposed entry and stop.
Next lesson
C03.1 · Moving Averages: SMA, EMA and Lag. Carry forward the same strict confirmation standard.
Student clarity check
Could you explain the idea in your own words, reproduce the calculation and complete the exercise without seeing an instructor's answer? Does the diagram actually show the concept? Please record exact lesson codes and specific points of confusion for the independent Claude audit.