Risk-first learningIndependent practiceNo membership or sign-in required
Independent student audit copy. This revised Student Edition is still under instructor and learner review. The questions are formative only; formal grades and private answer keys are not available here.
FOREX VISUAL LAB · C02.4
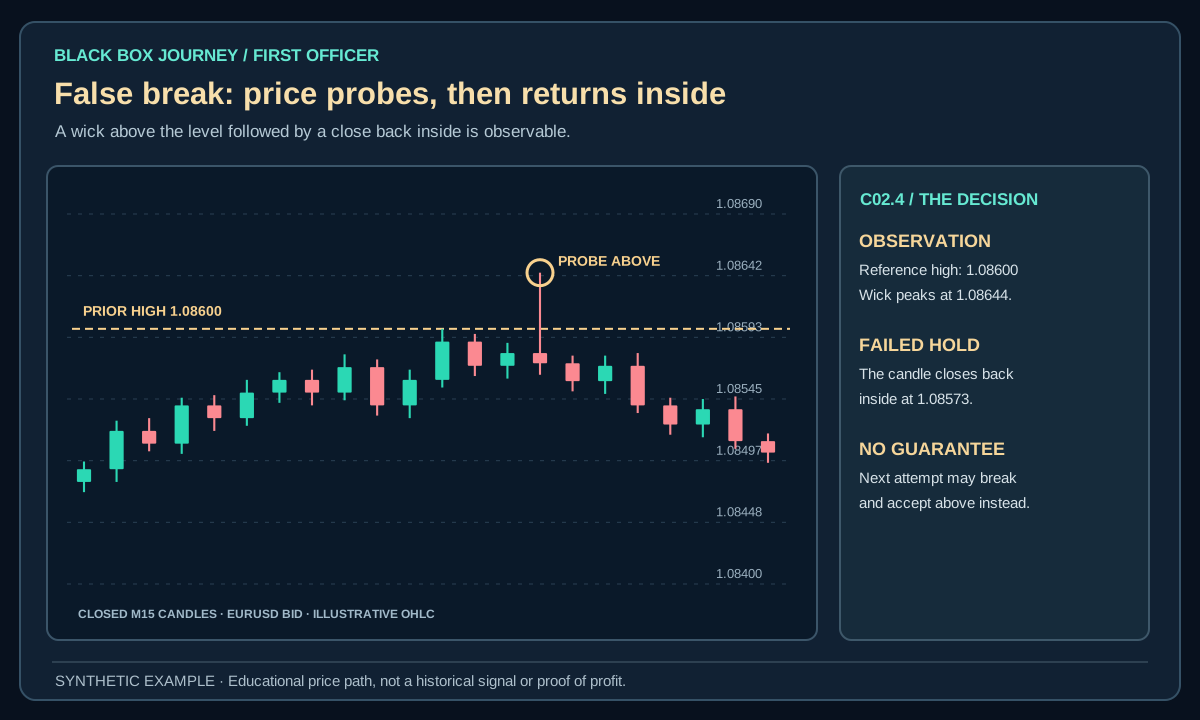
A wick is not confirmation.
Failed high-side breach of a resistance area
EURUSD · M15 · BID
What the candles show
The EURUSD wick prints above 1.08510, but that candle closes below the line. No close-confirmed breakout has occurred.
Important distinction
A wick-only probe plus rejection can be a candidate failed break under a frozen rule. OHLC does not prove actual institutional stops or positions.
A failed break does not guarantee a reversal, or prove who placed the orders. Five-decimal quotes and labels follow EURUSD conventions; broker feed conventions vary.
First Officer · C02: Price Action · About 25–30 minutes
Safety rule: A candle formation cannot guarantee a market move. Define the cash loss before interpreting upside.
Your mission today
By the end you can recognise a failed range break without claiming to know other traders' positions.
Before you start
Use the completed C01 market-structure lessons, a demo price chart and a calculator. Mark reference levels before replay. Every number is imaginary.
1. Understand the pattern
A door may open briefly and then swing shut. A false breakout is a move beyond a defined boundary that fails according to a stated return rule. The chart can suggest that some participants are surprised, but OHLC alone cannot prove their intentions or positions.
A false breakout describes a probe beyond a well-observed boundary followed by rejection into the old range. Traders sometimes interpret it as trapped breakout participants, but individual motives cannot be observed from candles alone. The practical lesson is that a boundary breach and sustained acceptance are different events.
2. Worked example: what could be lost?
An imaginary index trades between 300 and 310, spikes to 312, then closes at 308. A proposed short at 308 with invalidation above 312.5 has 4.5 points of downside if wrong. At $4 per point, planned loss is −$18 before fees. A return to 305 might bring +$12, but the failed-break story is not a prediction.
Open the diagram for full-size detail on a mobile screen. All illustrated prices are synthetic unless explicitly sourced as historical market data.
Original Black Box Journey teaching schematic. Imaginary prices and outcomes only.
BLACK BOX JOURNEY · LESSON VISUAL WORKSHOP
See the concept, the decision and the mistake
3 original teaching figures for lesson C02.4. Read each panel in order and compare the chart, calculation or decision with the explanation above. Tap Expand for a full-size review. Diagrams and prices are classroom illustrations, not live market records or validated trading signals.
Loading 3 teaching visuals…
3. Read the full context
Mark the range boundaries before price probes them. Define how far a break must go, how quickly it must return and what close confirms the failure. Establish the invalidation above the probe extreme for a short, or below it for a long. A mere new high is not an automatic sell.
Technical detail: Require the range to be drawn before the probe. Define how far the price must exceed the boundary, how quickly it must return, what close confirms failure, and where the reversal thesis becomes wrong. Account for spreads and stop slippage because false breaks can be rapid.
4. Watch for the failure case
Repeated probes may turn into a genuine trend. A fast reversal can create worse fills or wider spreads. Test all qualifying failed breaks, including those that continue against the proposed reversal.
Shorting every new high is simply fading momentum with a fancy name. In a strong trend, repeated upside probes can develop into a real breakout and punish automatic reversals.
5. Practise a reproducible decision
Collect twenty boundary probes in replay and classify confirmed break, false break and no decision. Include losers, slippage assumptions and the time the failure was actually knowable.
For comparison, the original source's example illustrates: A synthetic index oscillates between 300 and 310. It spikes to 312, then closes at 308 within the same bar. A trader considering a short waits for a clear failure rule and places invalidation beyond the sweep extreme. A return to the middle of the range might be a candidate objective; it is not a certainty.
6. Count the attempted breaks that do not hold
Synthetic EURUSD comparison: A premarked resistance area ends at 1.08600. Candle A reaches 1.08630 but closes at 1.08580. That is a wick-through with close-back under a close-based rule. Candle B closes at 1.08620, then the next completed candle closes at 1.08560. That is an initial close-through followed by a return. They are different events. Neither proves that a particular group of traders was trapped; order-book and position data would be needed for that stronger claim.
Suppose an imaginary long opened at Ask 1.08625 with a Bid stop at 1.08535. The 9-pip planned price risk would be −$9 at $1 per pip before costs if the stop filled there. A hypothetical Bid exit at 1.08715 would instead be +$9. The absence of one outcome cannot be predicted from the candle colour alone.
Practice record: Define a failure window, such as the next two completed M15 candles, before chart replay. Record every qualifying breach, including ones that continue successfully. For each, log the precise boundary, breakout close, return close and whether your decision at that time was TRADE, WAIT or SKIP. This is how a story becomes a testable observation.
Common mistake
A pattern name alone cannot approve an order. Always require a premarked reference, an exact confirmation rule, a structural failure level and a feasible cash-risk calculation.
Plain-English glossary
False breakout: A break that returns under a declared failure rule.
Sweep: A brief move through a premarked price area.
Invalidation: The observation that makes a proposed idea wrong.
Range boundary: A previously drawn upper or lower area.
Try it yourself
Collect twenty boundary probes in replay and classify confirmed break, false break and no decision. Include losers, slippage assumptions and the time the failure was actually knowable. Save every eligible and skipped candidate at the decision timestamp.
PRACTISE · TEST YOUR UNDERSTANDING
Quick check
Select an answer or type your own for each question. Press Submit practice to review the five responses. This is a formative beta exercise, not a graded assessment.
0 / 5 answered
Answer all 5 questions to submit.
What you can now do
Recognise a failed range break without claiming to know other traders' positions.
State a concrete observation that would disqualify the idea.
Calculate the loss from the proposed entry and stop.
Next lesson
C02.5 · Entry, Invalidation and Trade Location. Carry forward the same strict confirmation standard.
Student clarity check
Could you explain the idea in your own words, reproduce the calculation and complete the exercise without seeing an instructor's answer? Does the diagram actually show the concept? Please record exact lesson codes and specific points of confusion for the independent Claude audit.