Risk-first learningIndependent practiceNo membership or sign-in required
Independent student audit copy. This revised Student Edition is still under instructor and learner review. The questions are formative only; formal grades and private answer keys are not available here.
First Officer · C01: Market Structure · About 25–30 minutes
Safety rule: A chart label is not a forecast. Define your failure point and cash loss before considering any trade.
Your mission today
By the end you can read higher-timeframe context and lower-timeframe detail without mixing incomplete candles.
Before you start
Complete Second Officer and have an H4, H1 or M15 demo chart with replay. Use a paper worksheet for every example. All numbers below are imaginary educational figures.
1. See the idea clearly
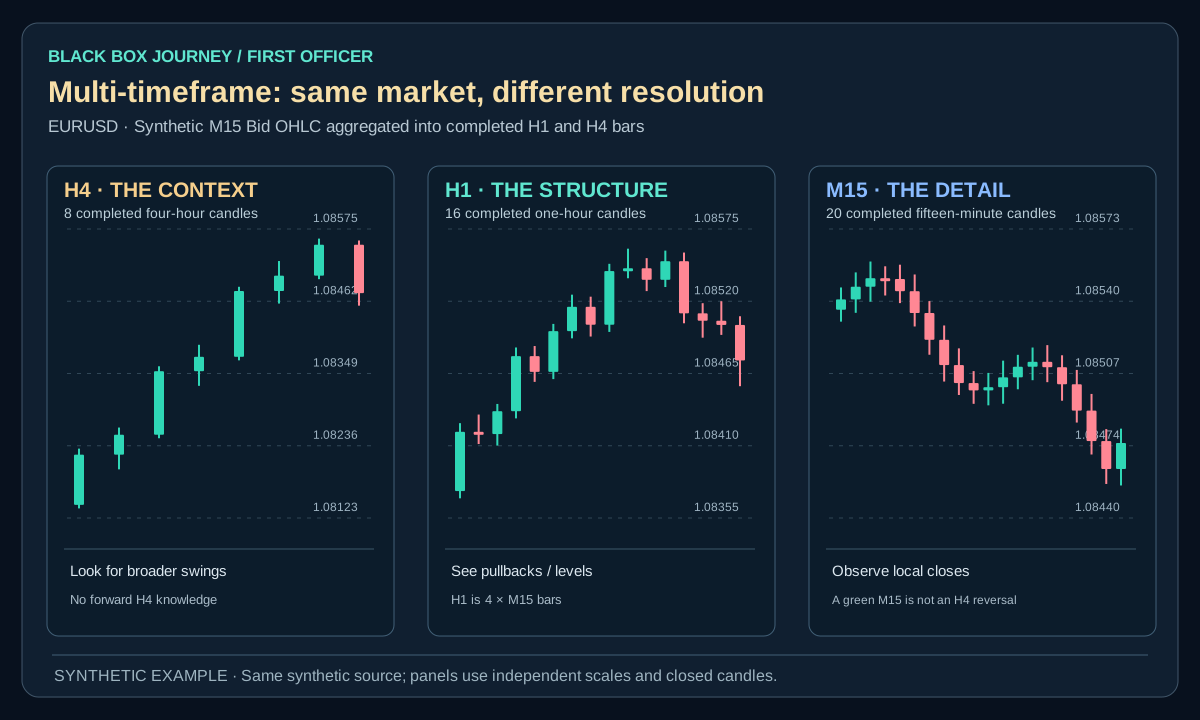
A satellite map and street view show the same city from different distances. An H4 chart summarises four hours per candle, H1 one hour and M15 fifteen minutes. A single M15 green candle cannot overturn a confirmed H4 structure on its own.
Timeframes are different sampling resolutions of the same market, not independent votes. A higher timeframe can establish broad structure and key boundaries while a lower timeframe locates a conditional entry. Requiring four timeframes to show the same candle colour usually removes useful context without improving reasoning.
2. Worked example: loss before gain
Imagine H4 is down, H1 is consolidating and M15 rises for one candle. A proposed short at 1.0900 with a stop at 1.0920 has 20 pips planned downside. At $0.50 per pip the loss is $10, before costs. If price fell to 1.0860, the favourable result would be $20. Neither is permitted automatically from a high-timeframe bias; the lower-timeframe setup still needs explicit confirmation.
Open the diagram for full-size detail on a mobile screen. All illustrated prices are synthetic unless explicitly sourced as historical market data.
Original Black Box Journey schematic. Imaginary numbers; not a validated market strategy.
BLACK BOX JOURNEY · LESSON VISUAL WORKSHOP
See the concept, the decision and the mistake
3 original teaching figures for lesson C01.5. Read each panel in order and compare the chart, calculation or decision with the explanation above. Tap Expand for a full-size review. Diagrams and prices are classroom illustrations, not live market records or validated trading signals.
Loading 3 teaching visuals…
3. Apply a repeatable method
First decide your trading horizon, then select one context chart and one execution chart. Freeze higher-timeframe observations at their actual closing times. Record the H4 invalidation area, H1 setup area and M15 decision condition separately. A completed H4 bar cannot be used earlier than its close.
Technical detail from the preserved source: Start with one decision horizon, one higher timeframe for context and one lower timeframe for execution. Use completed bars for indicator values and confirm that the higher-timeframe bar was already closed at the decision time. Avoid mixing broker-server timestamps or future high/low values into historical analysis.
4. Know when the explanation fails
Different broker server time zones can change candle boundaries. An H4 candle still forming at the M15 decision timestamp does not yet have a final high, low or close. Avoid switching timeframes until you find one that agrees with a preferred trade.
Cherry-picking whichever timeframe supports the desired trade is confirmation bias. Strategies may also appear profitable when code accidentally reads the unfinished higher-timeframe bar's future close.
5. Practise without the advantage of hindsight
Choose fifteen replay decision points. For each, record the last completed H4 and H1 candles, then an M15 trigger or SKIP. Mark any situation where a later H4 close would have altered the view and exclude it from the earlier record.
The result of a single example never proves an earnings method. Keep both rejected and eligible observations. Evaluate the decision using information available then, not later candles.
6. Make the three timeframes answer different questions
Think of a map at three zoom levels. H4 describes the larger route; H1 shows the next turn; M15 shows where a step might be taken. Do not ask all three charts the same question. Synthetic EURUSD case: H4 has confirmed higher lows at 1.07800 and 1.08100. H1 is pulling back below a recent local high. M15 shows one strong green candle. The M15 candle is not sufficient evidence that the H1 pullback has ended.
Before considering any fictional trade, calculate the risk. A long opened at Ask 1.08480 and stopped at Bid 1.08360 has 12 pips of planned downside, or −$12 at an invented $1 per pip, before fees or slippage. A later Bid at 1.08600 would produce +12 pips in a separate possible path. Neither a green candle nor matching chart labels establishes the probability of either path.
Replay task: Freeze all three charts at the same decision timestamp. Write H4 context, H1 setup, M15 evidence, the cash-risk calculation and one objective no-trade condition. Ensure every swing you use was actually confirmed by that timestamp.
Common mistake
Suppose a student analyses an M15 entry at 10:15 but justifies it using an H4 candle that will not close until 12:00. The final H4 close was unavailable at entry time. Use the last completed H4 candle and record both timestamps, otherwise the backtest has look-ahead bias.
Plain-English glossary
H4: A four-hour chart candle.
H1: A one-hour chart candle.
M15: A fifteen-minute chart candle.
Top-down analysis: Reading a longer view before a shorter one.
Lookahead: Using data not yet available at the decision time.
Try it yourself
Choose fifteen replay decision points. For each, record the last completed H4 and H1 candles, then an M15 trigger or SKIP. Mark any situation where a later H4 close would have altered the view and exclude it from the earlier record. Save the initial chart, rule, decision timestamp and failure condition in your journal.
PRACTISE · TEST YOUR UNDERSTANDING
Quick check
Select an answer or type your own for each question. Press Submit practice to review the five responses. This is a formative beta exercise, not a graded assessment.
0 / 5 answered
Answer all 5 questions to submit.
What you can now do
Read higher-timeframe context and lower-timeframe detail without mixing incomplete candles.
State what observation would make the idea invalid.
Produce an independent closed-bar decision record.
Next lesson
C02.1 · Reading Candles in Context. Carry forward the same evidence and risk-first habits.
Student clarity check
Could you explain the idea in your own words, reproduce the calculation and complete the exercise without seeing an instructor's answer? Does the diagram actually show the concept? Please record exact lesson codes and specific points of confusion for the independent Claude audit.