Risk-first learningIndependent practiceNo membership or sign-in required
Independent student audit copy. This revised Student Edition is still under instructor and learner review. The questions are formative only; formal grades and private answer keys are not available here.
First Officer · C02: Price Action · About 25–30 minutes
Safety rule: A candle formation cannot guarantee a market move. Define the cash loss before interpreting upside.
Your mission today
By the end you can explain a candle's open, high, low and close without treating its colour as an entry signal.
Before you start
Use the completed C01 market-structure lessons, a demo price chart and a calculator. Mark reference levels before replay. Every number is imaginary.
1. Understand the pattern
A candle is like a short diary entry. The open says where the interval started, the high and low show its extremes, and the close says where it ended. It cannot tell you why a buyer or seller acted, and it cannot reveal where the next candle must go.
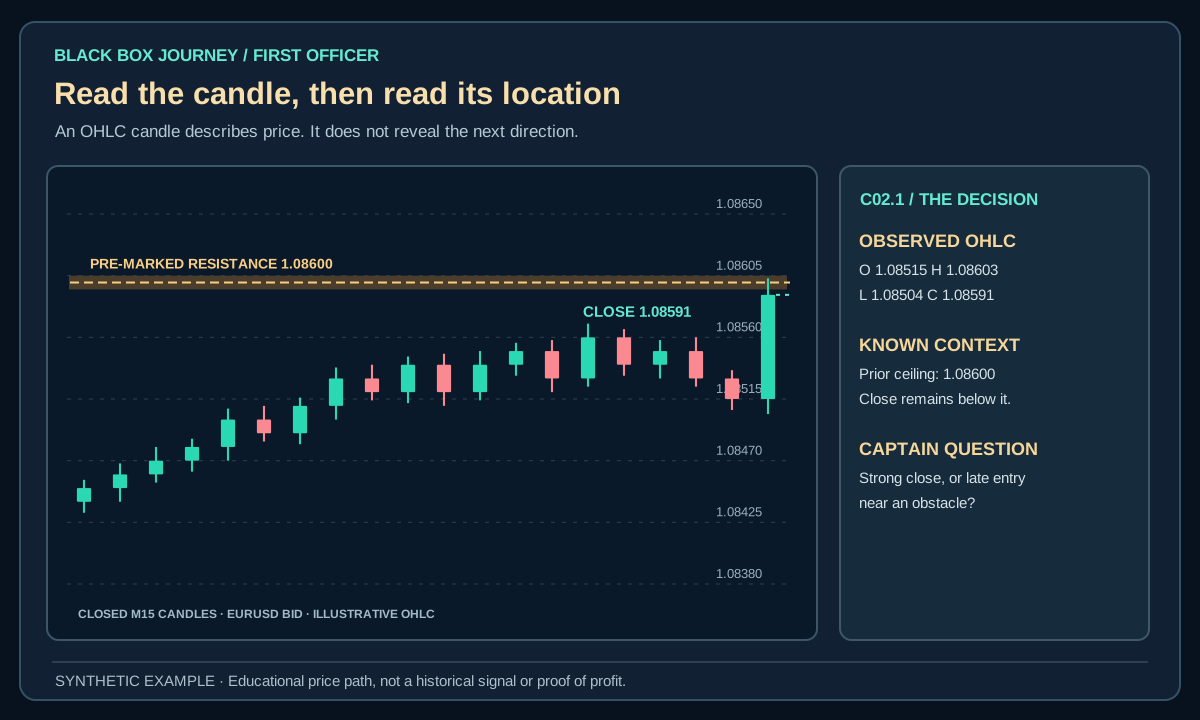
A candlestick is evidence of price movement over one interval, not a self-contained prediction. A large bullish body closing near its high may show directional pressure, yet the same candle at established resistance after a long rally has a different interpretation from one emerging after a broad consolidation.
2. Worked example: what could be lost?
An imaginary index candle opens at 200, falls to 198, rises to 207, then closes at 206.80. A late long at 206.80 with a stop at 202 risks 4.80 index points. At $2 per point, planned loss is −$9.60, before costs. A later gain to 210 would return +$6.40 gross, less than the proposed downside.
Open the diagram for full-size detail on a mobile screen. All illustrated prices are synthetic unless explicitly sourced as historical market data.
Original Black Box Journey teaching schematic. Imaginary prices and outcomes only.
BLACK BOX JOURNEY · LESSON VISUAL WORKSHOP
See the concept, the decision and the mistake
3 original teaching figures for lesson C02.1. Read each panel in order and compare the chart, calculation or decision with the explanation above. Tap Expand for a full-size review. Diagrams and prices are classroom illustrations, not live market records or validated trading signals.
Loading 3 teaching visuals…
3. Read the full context
Measure the range (high minus low) and body (absolute close minus open). Describe where the close falls within that range. Compare the candle with several earlier candles and a premarked H1 level. Do not infer actual buyer identities from the shape alone.
Technical detail: Analyse relative range versus recent candles, body-to-range ratio, wick position, close location and the nearby swing map. Ask who was trapped or forced to act, but treat such narratives as hypotheses unless you have order-flow evidence. A candle should contribute to a thesis rather than replace it.
4. Watch for the failure case
A large green body near major resistance can be exhaustion or continuation; the candle alone does not settle the question. Use completed candles and only information available before the next bar.
Overvaluing dramatic candle names or ignoring transaction costs turns attractive charts into poor trades. A candle's range alone does not tell you whether movement was tradable after the signal closed.
5. Practise a reproducible decision
On 15 closed candles, label OHLC, wick, body and nearby structure. Identify three that look strong but fail your own entry or risk gate.
For comparison, the original source's example illustrates: A candle opens at 200, falls to 198, rallies to 207 and closes at 206.80. It closes near the high, but if the next hour is a major news release and price sits below weekly resistance, buying automatically still lacks a defined edge. Wait for the rule your strategy actually tests.
6. Read a candle together with the candles around it
Synthetic EURUSD candles: One M15 candle opens at 1.08480, reaches 1.08550, dips to 1.08440 and closes at 1.08520. Its body is 4 pips, its upper wick is 3 pips and its lower wick is 4 pips. Those measurements tell you what happened within the completed bar. They cannot tell you why participants traded or what the next candle must do.
Now place the same candle in two settings. In the first, the H1 chart has made higher lows and price remains inside a rising range. In the second, the candle sits directly under a prior resistance area after a failed breakout. The candle's shape is identical, but the surrounding evidence is different. Record the context before assigning a bullish or bearish meaning.
For risk, imagine a long at Ask 1.08520 with a planned Bid stop at 1.08420. A 10-pip adverse move costs −$10 at an invented $1 per pip before other fees. A later Bid at 1.08620 would produce +$10 in a separate hypothetical outcome. A single candle cannot determine which will happen.
Practice record: Copy five candles with their previous three completed bars. Write body, both wicks, nearby level, timeframe and one reason to WAIT. No candle pattern is a stand-alone forecast.
Common mistake
A pattern name alone cannot approve an order. Always require a premarked reference, an exact confirmation rule, a structural failure level and a feasible cash-risk calculation.
Plain-English glossary
OHLC: Open, high, low and close of one period.
Body: Difference between candle open and close.
Wick: Part of a candle above or below its body.
Context: Surrounding structure, session and volatility.
Try it yourself
On 15 closed candles, label OHLC, wick, body and nearby structure. Identify three that look strong but fail your own entry or risk gate. Save every eligible and skipped candidate at the decision timestamp.
PRACTISE · TEST YOUR UNDERSTANDING
Quick check
Select an answer or type your own for each question. Press Submit practice to review the five responses. This is a formative beta exercise, not a graded assessment.
0 / 5 answered
Answer all 5 questions to submit.
What you can now do
Explain a candle's open, high, low and close without treating its colour as an entry signal.
State a concrete observation that would disqualify the idea.
Calculate the loss from the proposed entry and stop.
Next lesson
C02.2 · Rejection Wicks and Engulfing Formations. Carry forward the same strict confirmation standard.
Student clarity check
Could you explain the idea in your own words, reproduce the calculation and complete the exercise without seeing an instructor's answer? Does the diagram actually show the concept? Please record exact lesson codes and specific points of confusion for the independent Claude audit.