Risk-first learningIndependent practiceNo membership or sign-in required
Independent student audit copy. This revised Student Edition is still under instructor and learner review. The questions are formative only; formal grades and private answer keys are not available here.
First Officer · C02: Price Action · About 25–30 minutes
Safety rule: A candle formation cannot guarantee a market move. Define the cash loss before interpreting upside.
Your mission today
By the end you can describe a rejection wick or engulfing candle without assuming the pattern will reverse price.
Before you start
Use the completed C01 market-structure lessons, a demo price chart and a calculator. Mark reference levels before replay. Every number is imaginary.
1. Understand the pattern
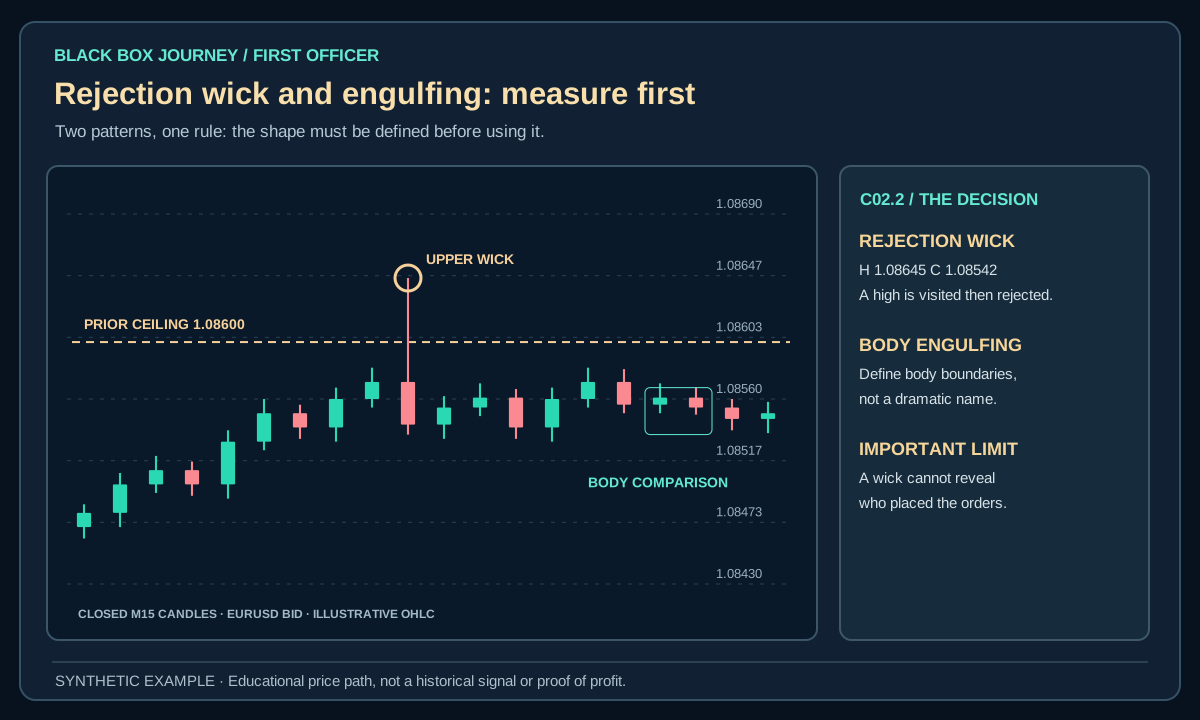
Imagine a ball bouncing off a wall. One bounce shows that the ball reacted there once, not that the wall will hold forever. A rejection wick shows price moved to an extreme and returned before the candle closed. An engulfing formation describes one candle's body covering another according to a defined rule.
A long wick shows that price visited one extreme but did not close there. An engulfing candle shows an expanded body relative to a previous body. Neither identifies the underlying participants conclusively. Their utility depends on location, prior momentum, prevailing volatility, and whether entry after the close leaves sensible risk.
2. Worked example: what could be lost?
An imaginary candle dips to 97 and closes at 100.80 near a previous support region. Buying at 100.80 with a stop at 96.80 risks 4 points. At $5 per point, that is −$20 before costs. If the nearest obstacle sits at 102, the possible distance is just 1.20 points, or +$6. A pretty wick can offer poor trade economics.
Open the diagram for full-size detail on a mobile screen. All illustrated prices are synthetic unless explicitly sourced as historical market data.
Original Black Box Journey teaching schematic. Imaginary prices and outcomes only.
BLACK BOX JOURNEY · LESSON VISUAL WORKSHOP
See the concept, the decision and the mistake
3 original teaching figures for lesson C02.2. Read each panel in order and compare the chart, calculation or decision with the explanation above. Tap Expand for a full-size review. Diagrams and prices are classroom illustrations, not live market records or validated trading signals.
Loading 3 teaching visuals…
3. Read the full context
Measure the wick length relative to the body and recent typical range. State whether the engulfing definition compares bodies or full highs and lows. Declare the exact support or resistance zone before testing. Use a closed candle, not an unfinished shape.
Technical detail: A rejection near a known range boundary can be a cue to investigate failed acceptance, while a large engulfing candle after a prolonged move may already consume much of the available distance. Define the shape mathematically and avoid hindsight selection. Compare the next-bar outcome of all qualifying patterns, not just memorable winners.
4. Watch for the failure case
Wicks can appear in both trends and ranges. Strong moves can immediately reverse again. Never assume a candle is a reliable entry merely because a trading textbook gave it a dramatic name.
A wick that looks long in isolation may be routine under that day's ATR. A strong candle can reverse immediately when spreads widen or liquidity thins.
5. Practise a reproducible decision
Collect five rejection wicks and five engulfing formations from hidden-forward replay. Write the shape rules and record both successful and unsuccessful subsequent reactions.
For comparison, the original source's example illustrates: A market dips from 101 to 97 and closes at 100.80, leaving a long lower wick near support at 97.50. Buying at 100.80 with a stop below 97 may give a wide risk relative to resistance at 102. The pattern can be visually convincing yet offer poor reward versus risk.
6. Confirm the pattern, then measure its limits
Synthetic EURUSD example: A candle opens at 1.08500, rises to 1.08570, falls to 1.08480 and closes at 1.08490. Its upper wick is 7 pips and its body is 1 pip. That looks like a strong rejection wick, but OHLC data alone cannot prove which orders created it. A bearish engulfing formation, meanwhile, uses a precise comparison between two completed candle bodies. Write whether your rule needs bodies or full wick ranges to overlap.
Assume a trader sells at Bid 1.08485 and plans to exit if Ask reaches 1.08575. The 9-pip planned adverse move produces −$9 at a hypothetical $1 per pip before commissions and worse fills. A later Ask of 1.08405 would produce +8 pips in one other possible path. The wick's appearance supplies no guarantee that either exit will occur.
Replay task: For eight candidate candles, record opening and closing prices, total range, upper and lower wick length, and whether the previous completed candle is needed to classify the pattern. Include examples that look dramatic but fail the prewritten definition. Judge the body and the surrounding structure separately.
Common mistake
A pattern name alone cannot approve an order. Always require a premarked reference, an exact confirmation rule, a structural failure level and a feasible cash-risk calculation.
Plain-English glossary
Rejection wick: A candle tail showing an extreme not held at close.
Engulfing: A candle pattern defined by one range or body covering another.
Body: Distance between open and close.
ATR: Average true range, a measure of recent price movement size.
Try it yourself
Collect five rejection wicks and five engulfing formations from hidden-forward replay. Write the shape rules and record both successful and unsuccessful subsequent reactions. Save every eligible and skipped candidate at the decision timestamp.
PRACTISE · TEST YOUR UNDERSTANDING
Quick check
Select an answer or type your own for each question. Press Submit practice to review the five responses. This is a formative beta exercise, not a graded assessment.
0 / 5 answered
Answer all 5 questions to submit.
What you can now do
Describe a rejection wick or engulfing candle without assuming the pattern will reverse price.
State a concrete observation that would disqualify the idea.
Calculate the loss from the proposed entry and stop.
Next lesson
C02.3 · Breakouts and Retests. Carry forward the same strict confirmation standard.
Student clarity check
Could you explain the idea in your own words, reproduce the calculation and complete the exercise without seeing an instructor's answer? Does the diagram actually show the concept? Please record exact lesson codes and specific points of confusion for the independent Claude audit.